Univid Webinar Insights 2026
2026 Webinar Statistics Report - 35 facts from anonymized data on 325K+ webinar attendees and hosts on Univid. Exclusive benchmarks on attendance, engagement, and conversion rates.

Contents
35 Webinar Statistics to know [Webinar Report 2026]
Introduction
About this report
This 2026 report analyzes +2,000 webinars hosted on Univid between January 2023 and Aug 31, 2026 across SaaS, B2B software, professional services, education, and events.
Type of webinars: The dataset is made up of external facing webinars - with majority being sales & marketing webinars for B2B. Also, including a minority of datapoints in customer success webinars towards existing customers and communities.
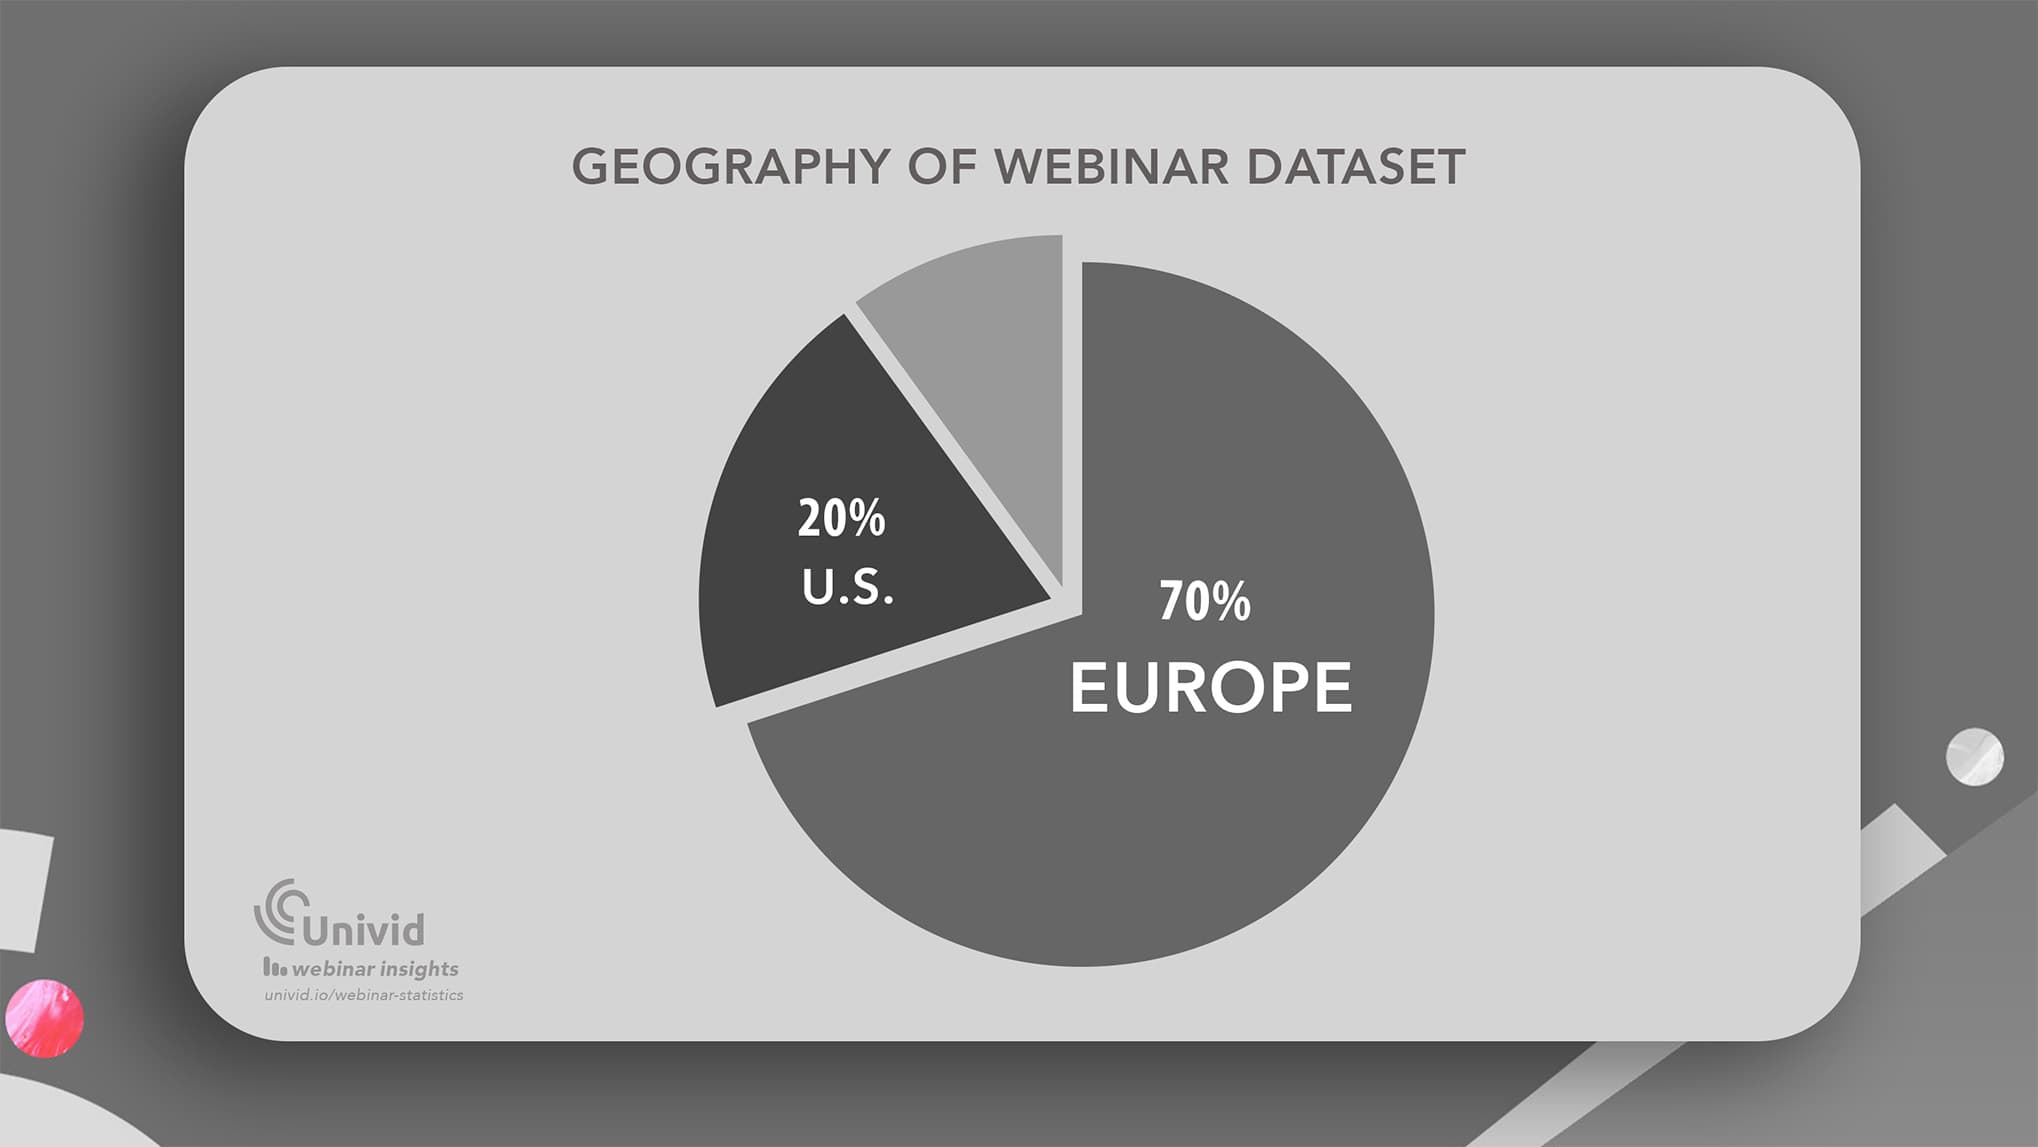
Geography: Geography wise the dataset is made up of 70% European datapoints, 20% US, and 10% other regions.
Methodology
A team of webinar experts aggregated anonymized session- and attendee-level data. Such as registrations, join behavior, watch time, engagement actions, and conversions.
This dataset provides a unique set of real-world benchmarks for attendance, engagement, promotion, timing, format, and ROI.
Unless otherwise noted, figures represent median values by webinar, with outliers winsorized at the 1st/99th percentiles.
Why it matters: Unlike survey opinions, these benchmarks come from observed behaviour across 1000s of real webinars and over 325,000 webinar attendees and hosts - making them practical guidelines to plan out your webinar strategy.
General webinars statistics
Let's look at a video summary below of 10 webinar statistics that shows the growth of webinars in 2026, how B2B marketers use live webinars, and why webinars seem to deliver authentic relationships and convert so well.
Are webinars dead?! TLDR; no. Check out all the webinar statistics and learn more below.
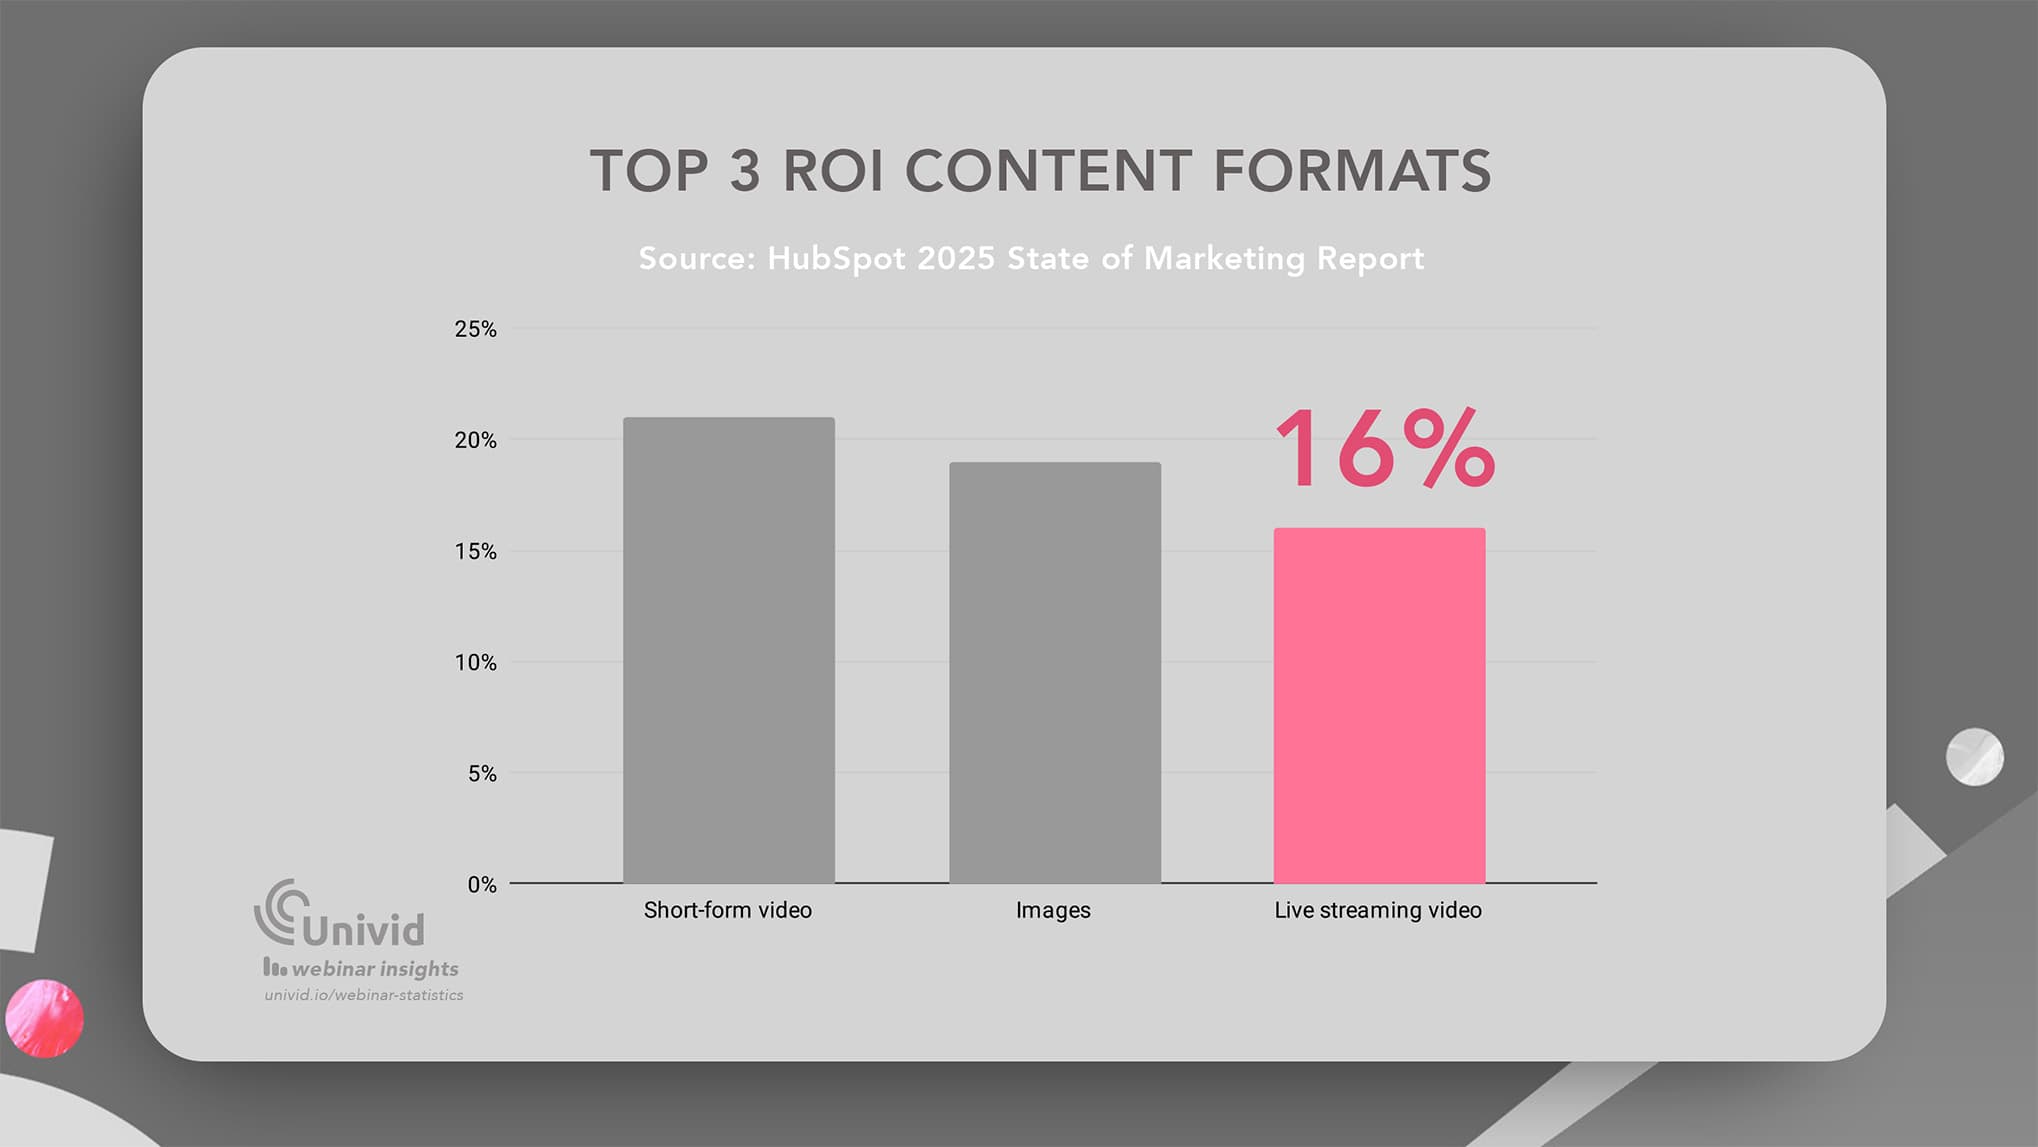
1. Live streaming video is among the top ROI content formats in 2026
(Source: HubSpot 2025 State of Marketing Report)
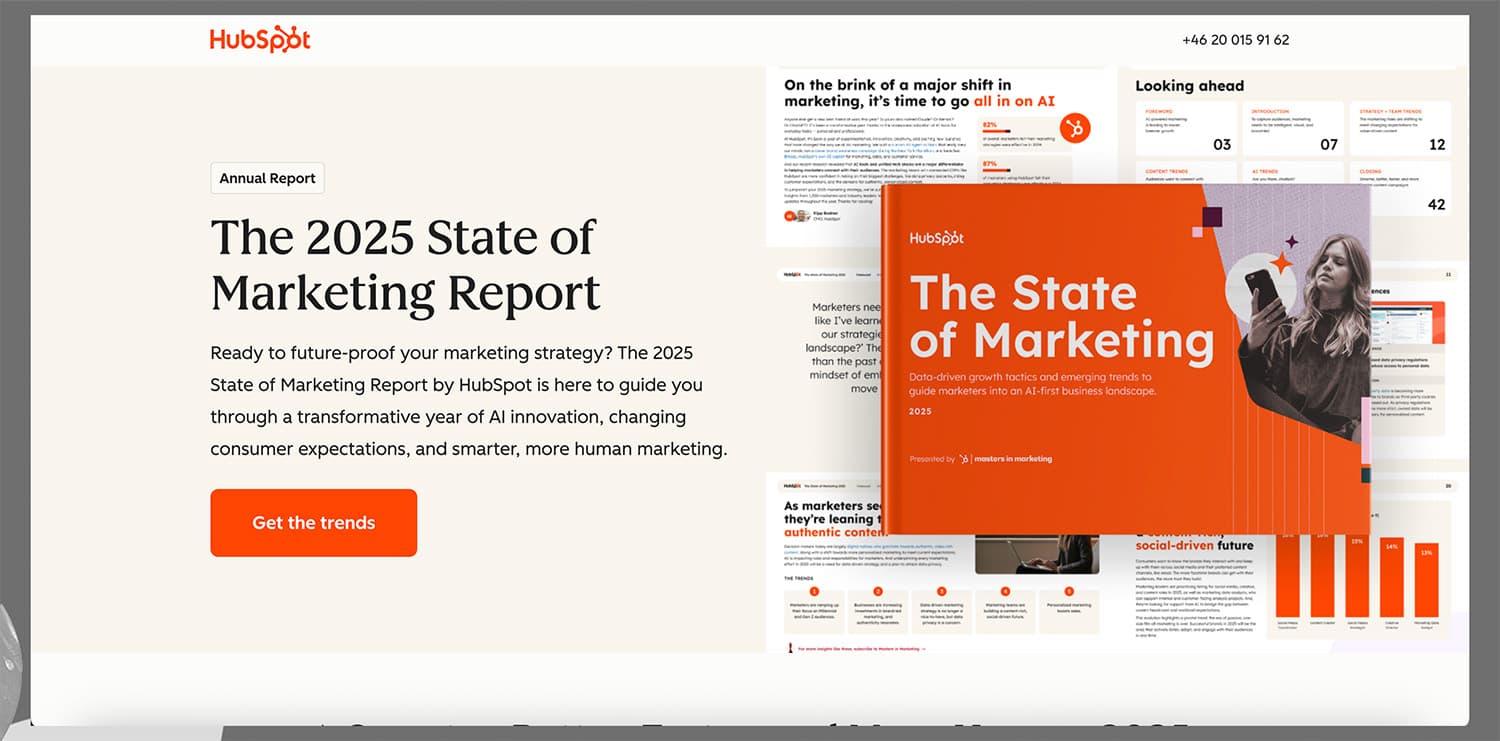
Visual storytelling is overtaking text-heavy content formats, HubSpot reports as their #1 trend in their HubSpot 2025 State of Marketing Report.
According to the report, marketers say live streaming video (16%) deliver the highest return on investment (ROI) across all content formats, together with short-form video (21%), and images (19%).
And according to HubSpot, marketers plan to invest more into these channels in 2025.
The webinar format both provide a way to get your visual storytelling through, as well as live aspect, where attendees can engage and build a relationship with your brand.
2. Webinars are the second-fastest-growing event type in B2B
(Source: Forrester Global State Of B2B Events)
According to Forrester’s B2B event survey, 58% of marketers plan to increase small, hosted in-person events, making that the fastest-growing event format. And webinars are the second-fastest-growing event type, with particularly strong adoption among midsized and North American organizations.
Thus, webinars remain a key strategic growth channel in 2026 that businesses keep doubling down on.
3. More than half of B2B marketers used webinars in the last 12 months (56%)
(Source: Content Marketing Institute 2024)
Regarding the channels used to distribute content, Content Marketing Institute reports that webinars are used about 56% of the B2B marketers as content distribution channel, when measured over the last 12 months.
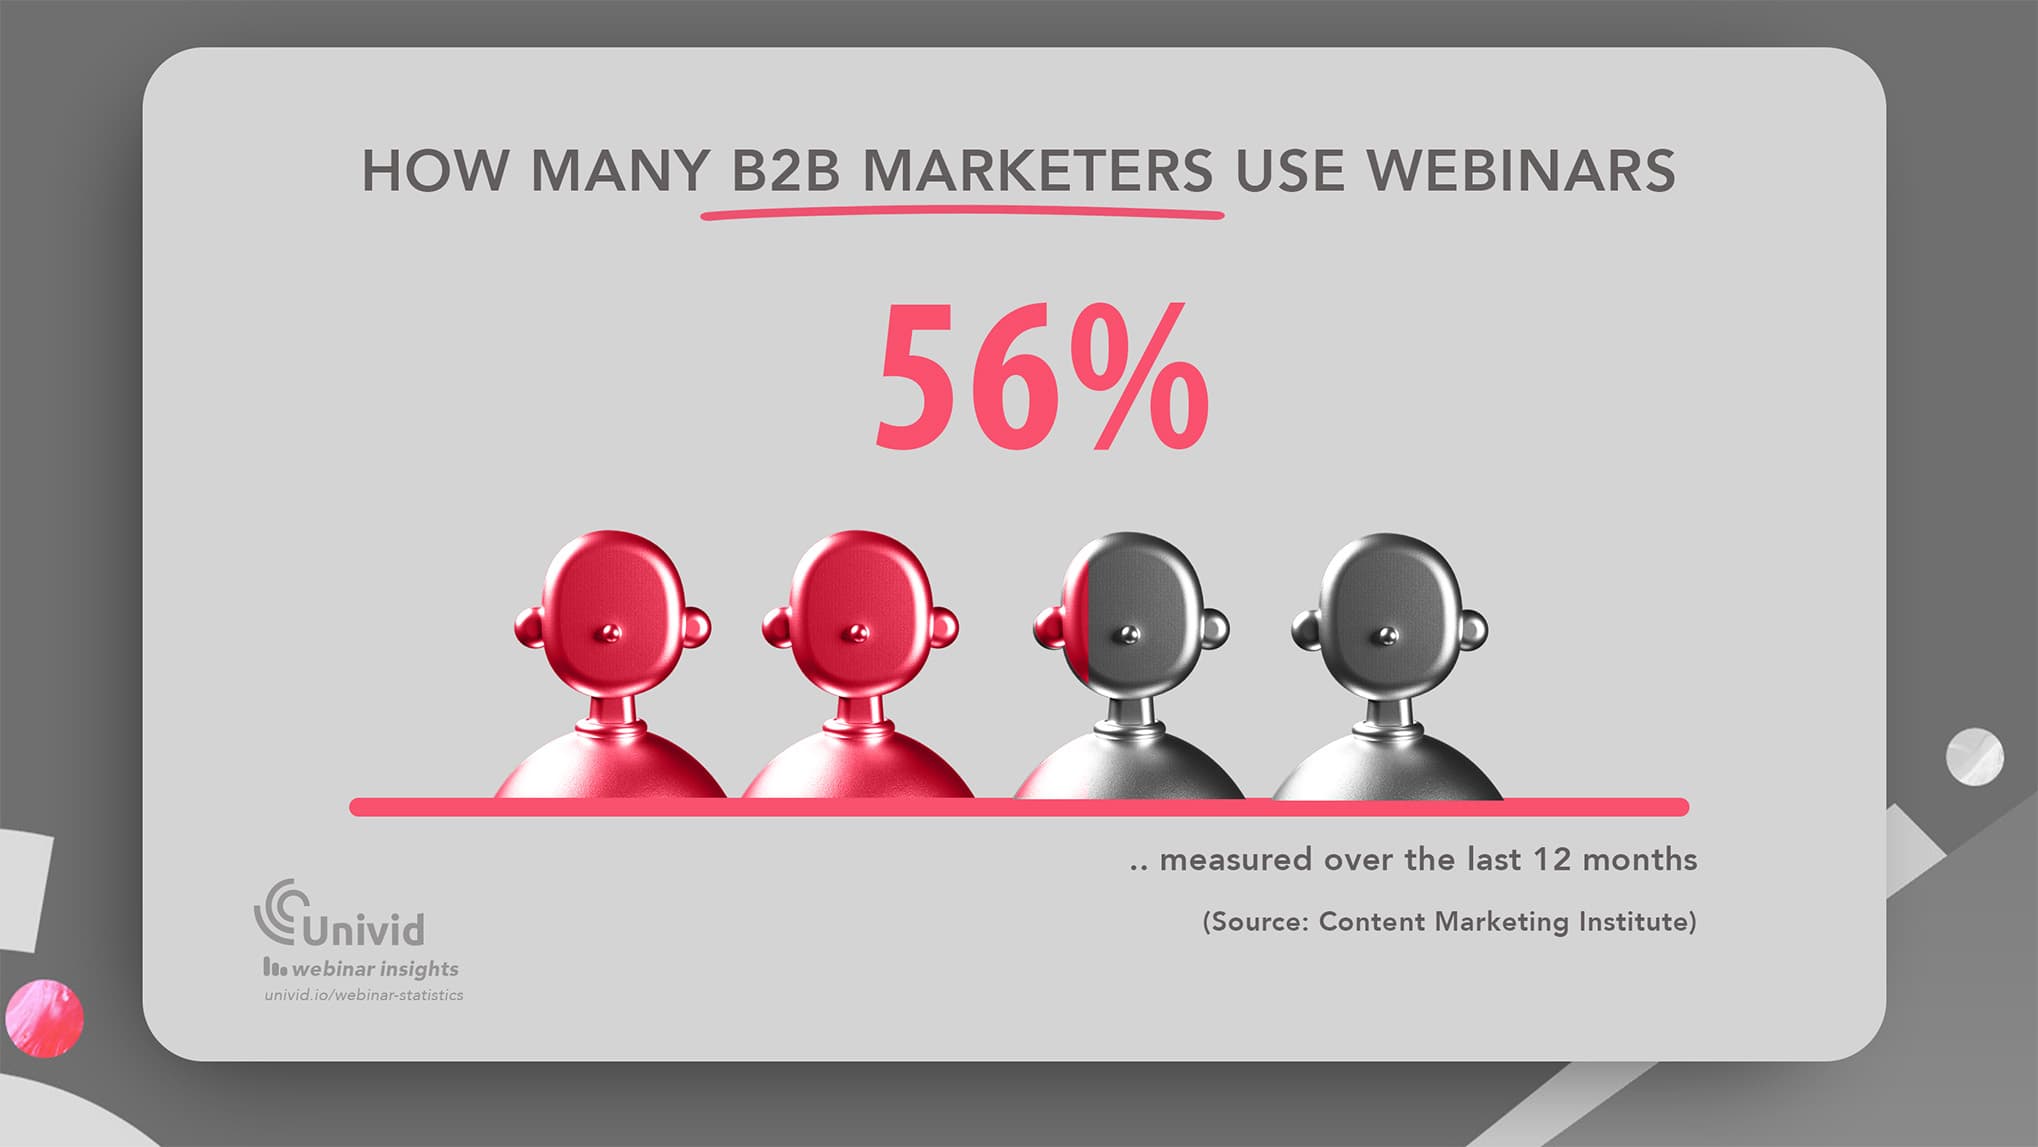
Webinar popularity amongst B2B Marketers
Other popular distribution channels of the marketers asked, were social media platforms such as LinkedIn (organic), blogs (79%), email newsletters (73%), and in-person events (56%).
4. Webinars produce the second best results of any distribution channel (51%)
(Source: Content Marketing Institute 2024)
Webinars top Content Marketing Institute's list of most effective content distribution channels - where 51% of B2B marketers think webinars produce the best results of all the channels.
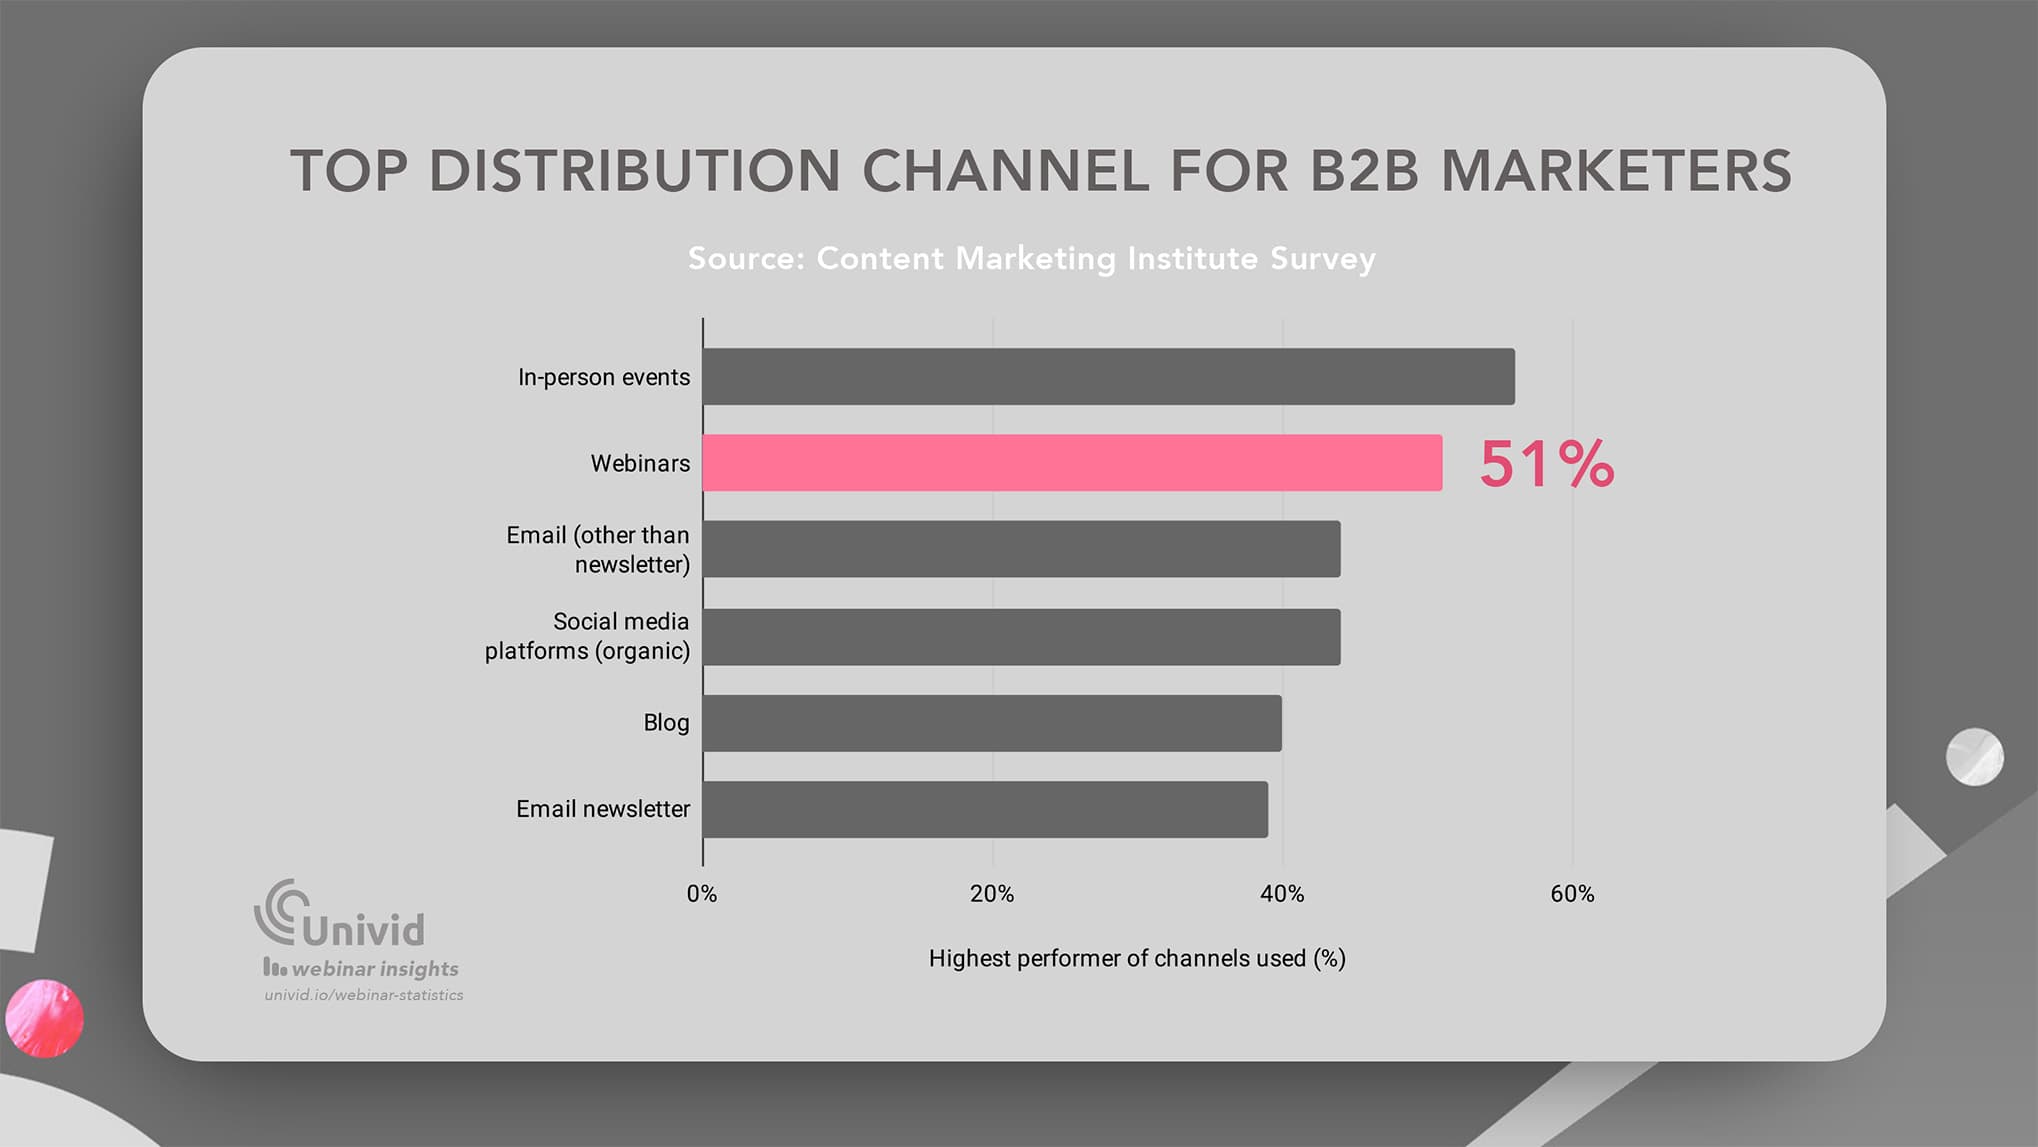
Question asked by Content Marketing Institute survey to B2B marketers: "Of those you used, which channels produced the best results for your organization in the last 12 months?"
B2B marketers also found in-person events to be efficient (56%), emails (44%), social media (44%), blog (40%), and newsletters (39%).
Webinar viewing statistics
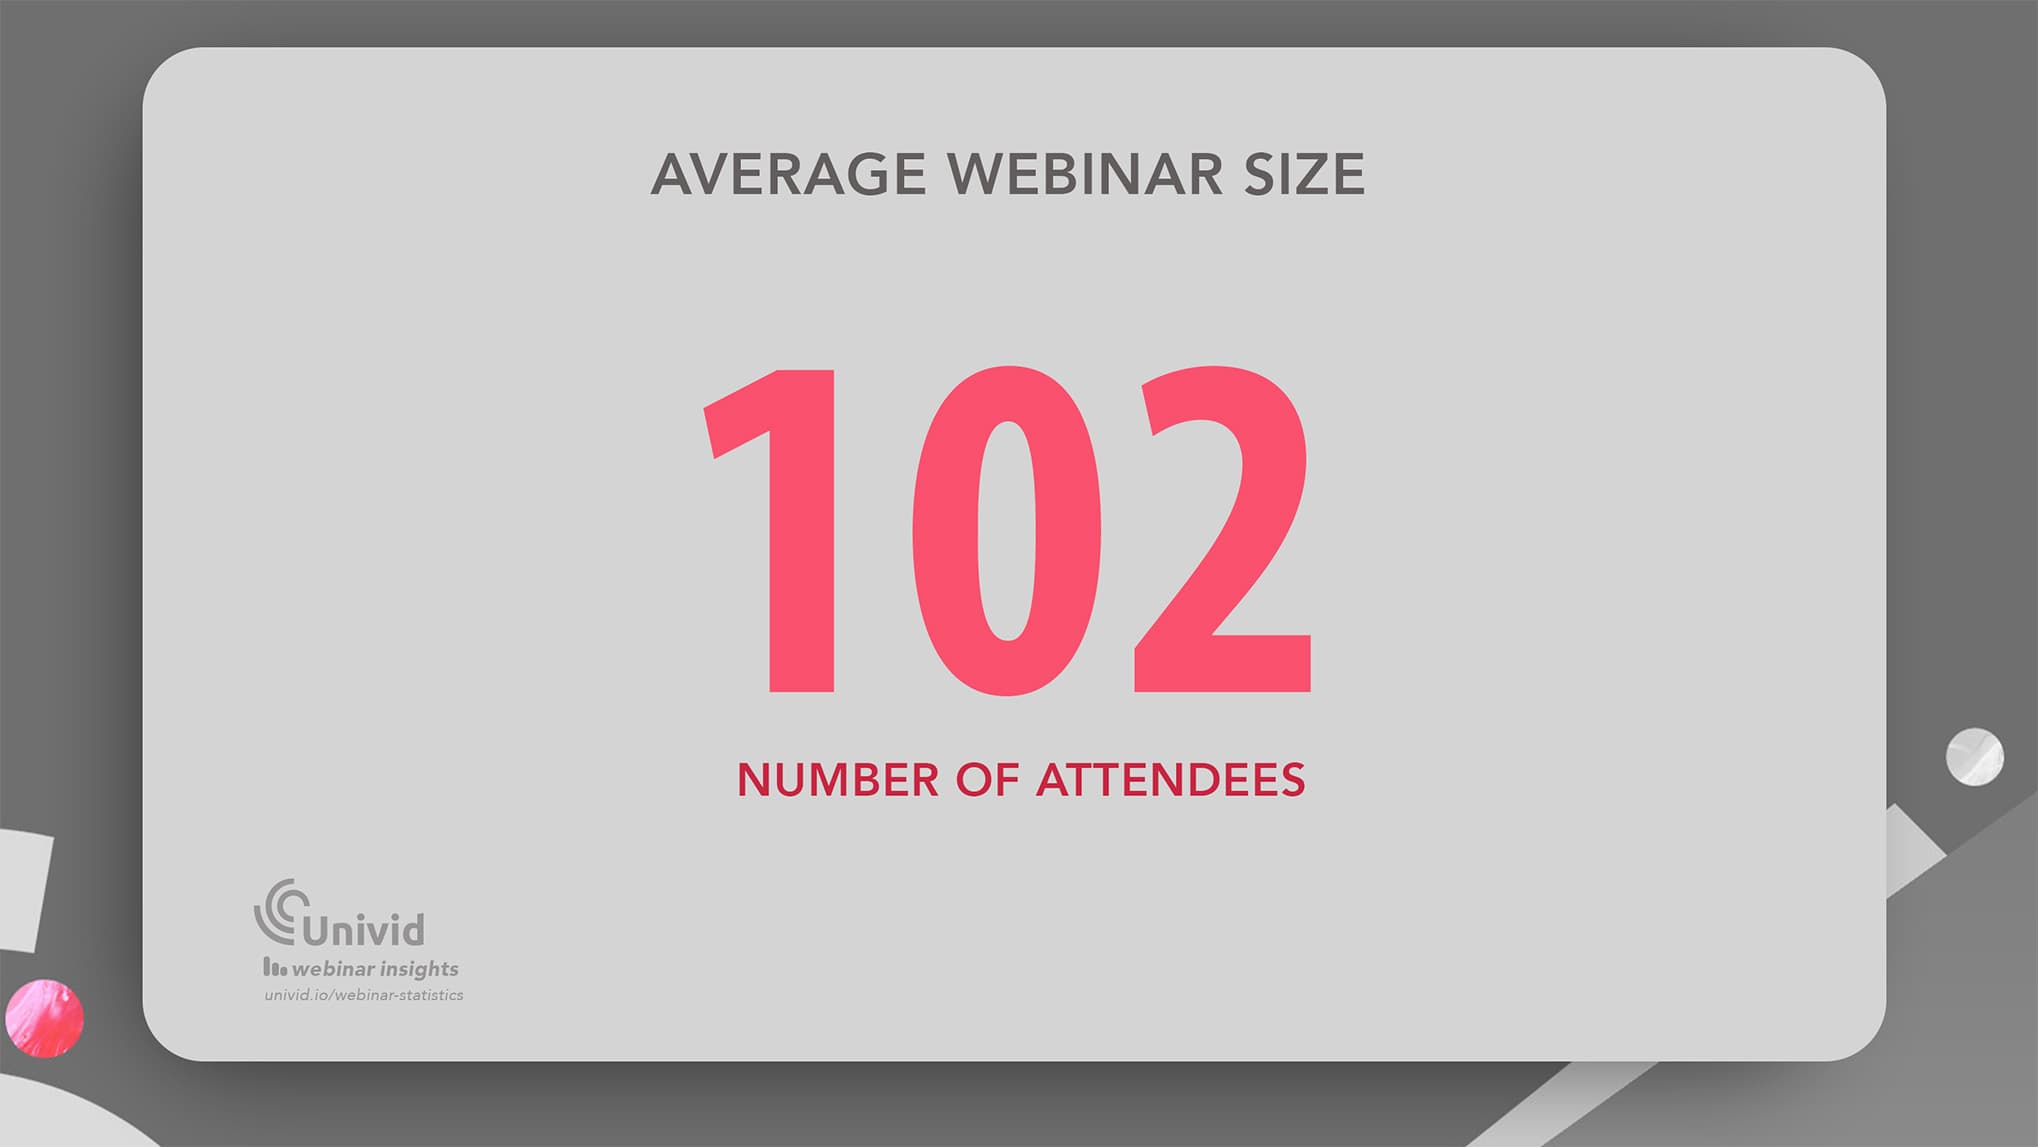
5. Webinars have on average 102 live attendees
(Source: Univid Webinar Insights 2026)
Univid data shows that the average number of live attendees in webinars is 102.
6. 71% of webinars have fewer than 100 live attendees
(Source: Univid Webinar Insights 2026)
And majority webinars are on the smaller side, where 50% of webinars have fewer than 50 live attendees, and 71% of webinars have less than 100 live attendees.
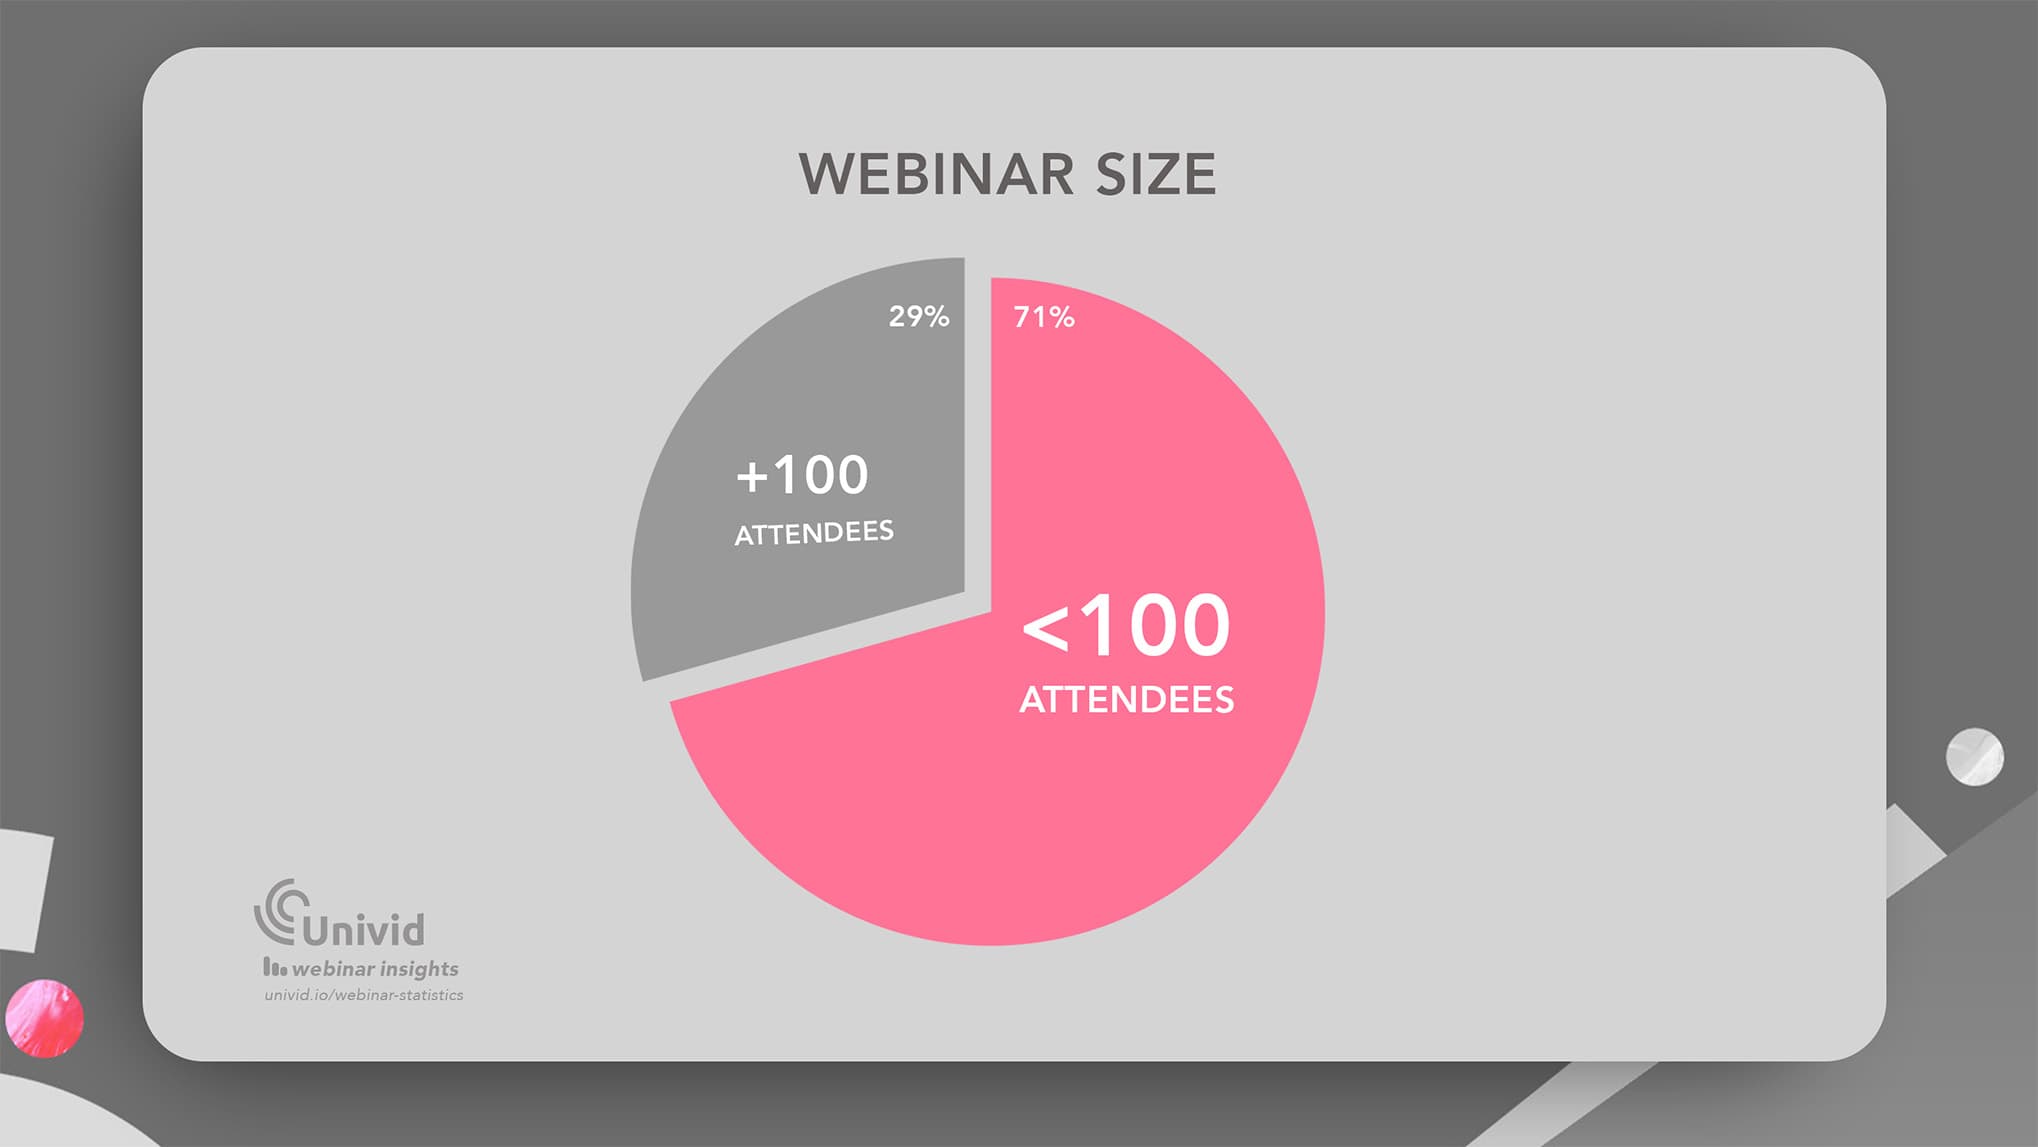
Only around 3% of webinars have between 501-1000 live attendees, and around 1% more than 1000 live attendees.
💡 Note: Niche and targeted webinars see higher ROI compared to broad, “all-in-one” webinars. Splitting content into two shorter webinars is often more impactful than running one long webinar.
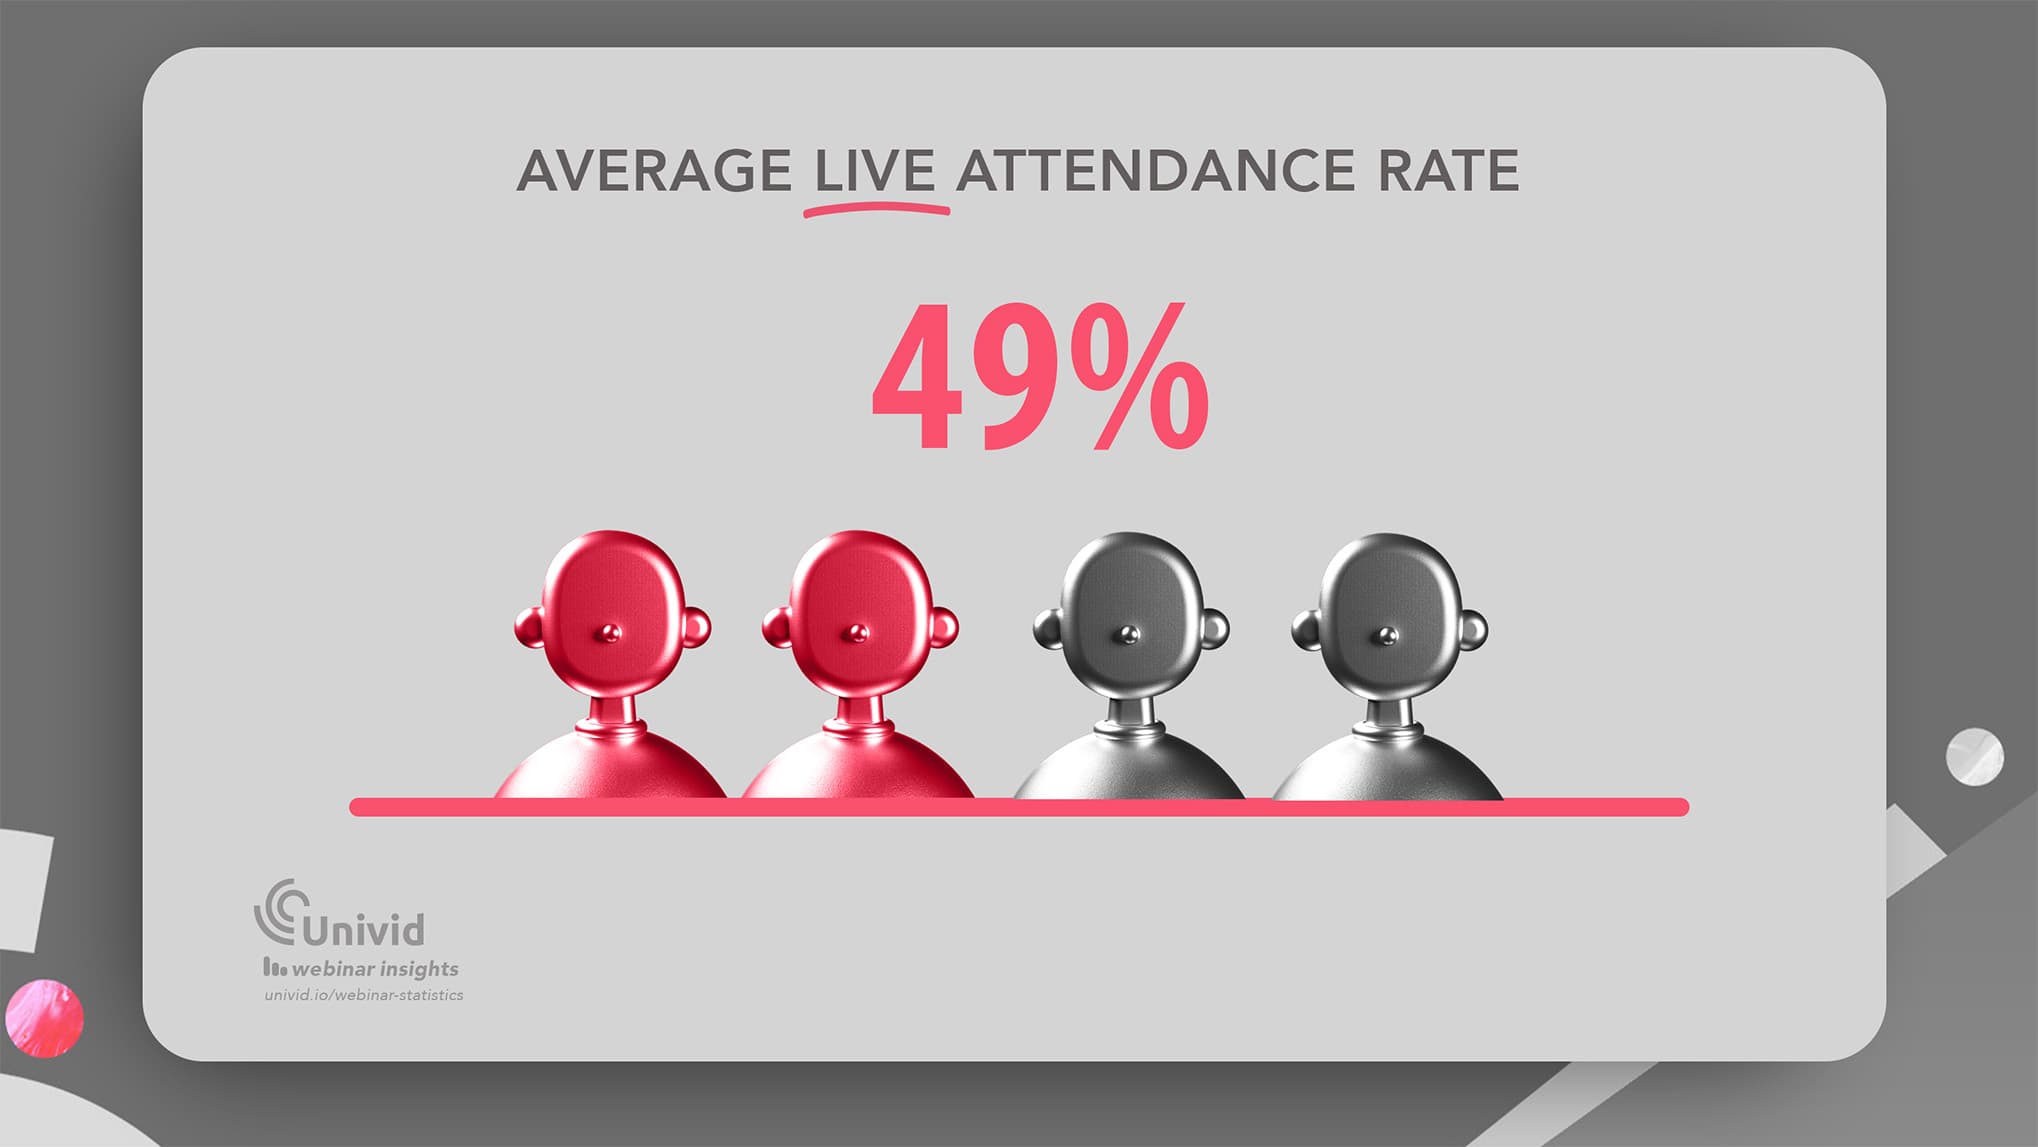
7. The average live attendance rate is 49%
(Source: Univid Webinar Insights 2026)
For webinars, the average live attendance rate is 49%. Meaning almost 2 of 4 people show up to watch the webinar live.
8. Total attendance rate across live and replay is 57%
(Source: Univid Webinar Insights 2026)
Counting both the live and replay (on-demand webinar), about 6 out of 10 people take part in the content in some way (57%) - either watching live, on-demand, or both.
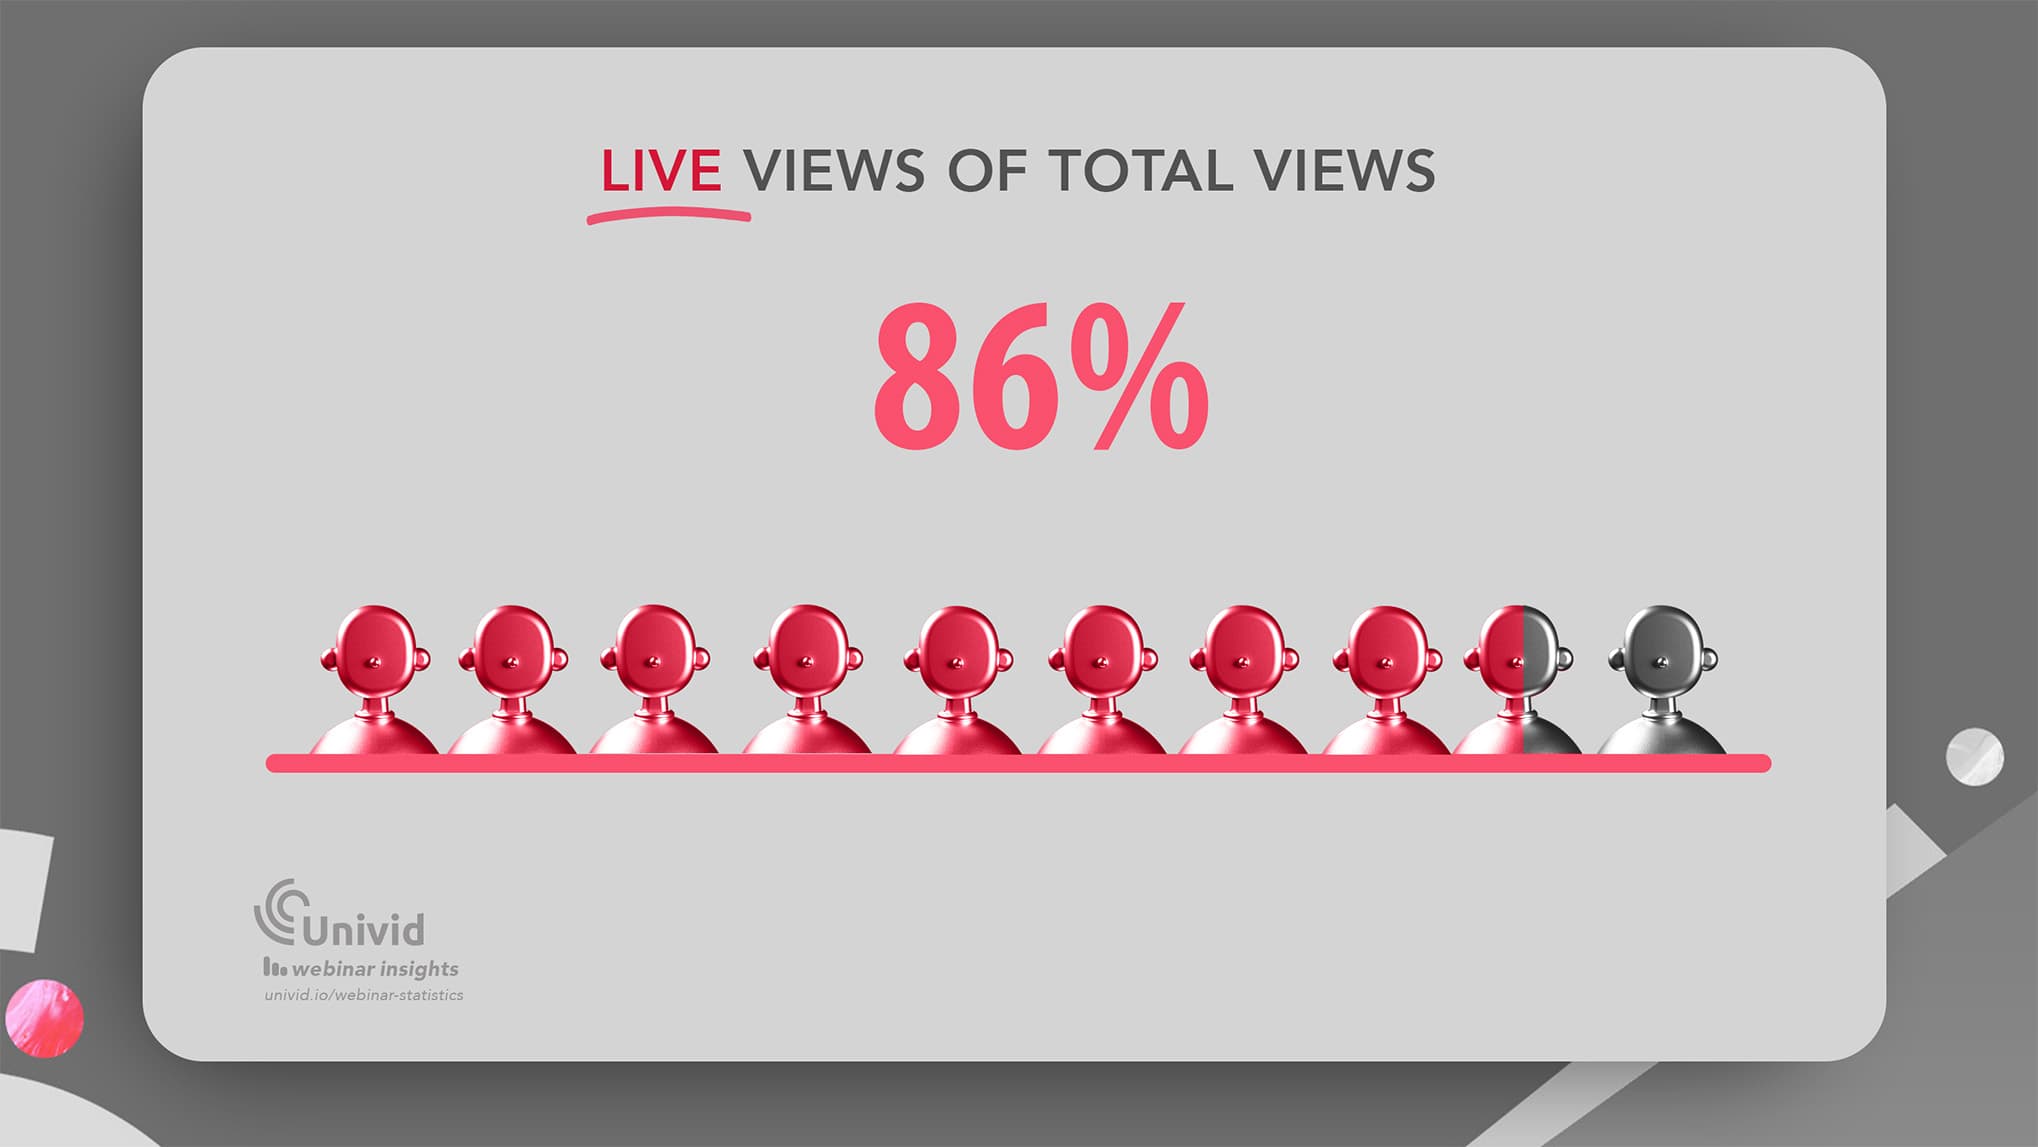
9. 86% of webinar views happen live
(Source: Univid Webinar Insights 2026)
Are webinars taking place live or on-demand?
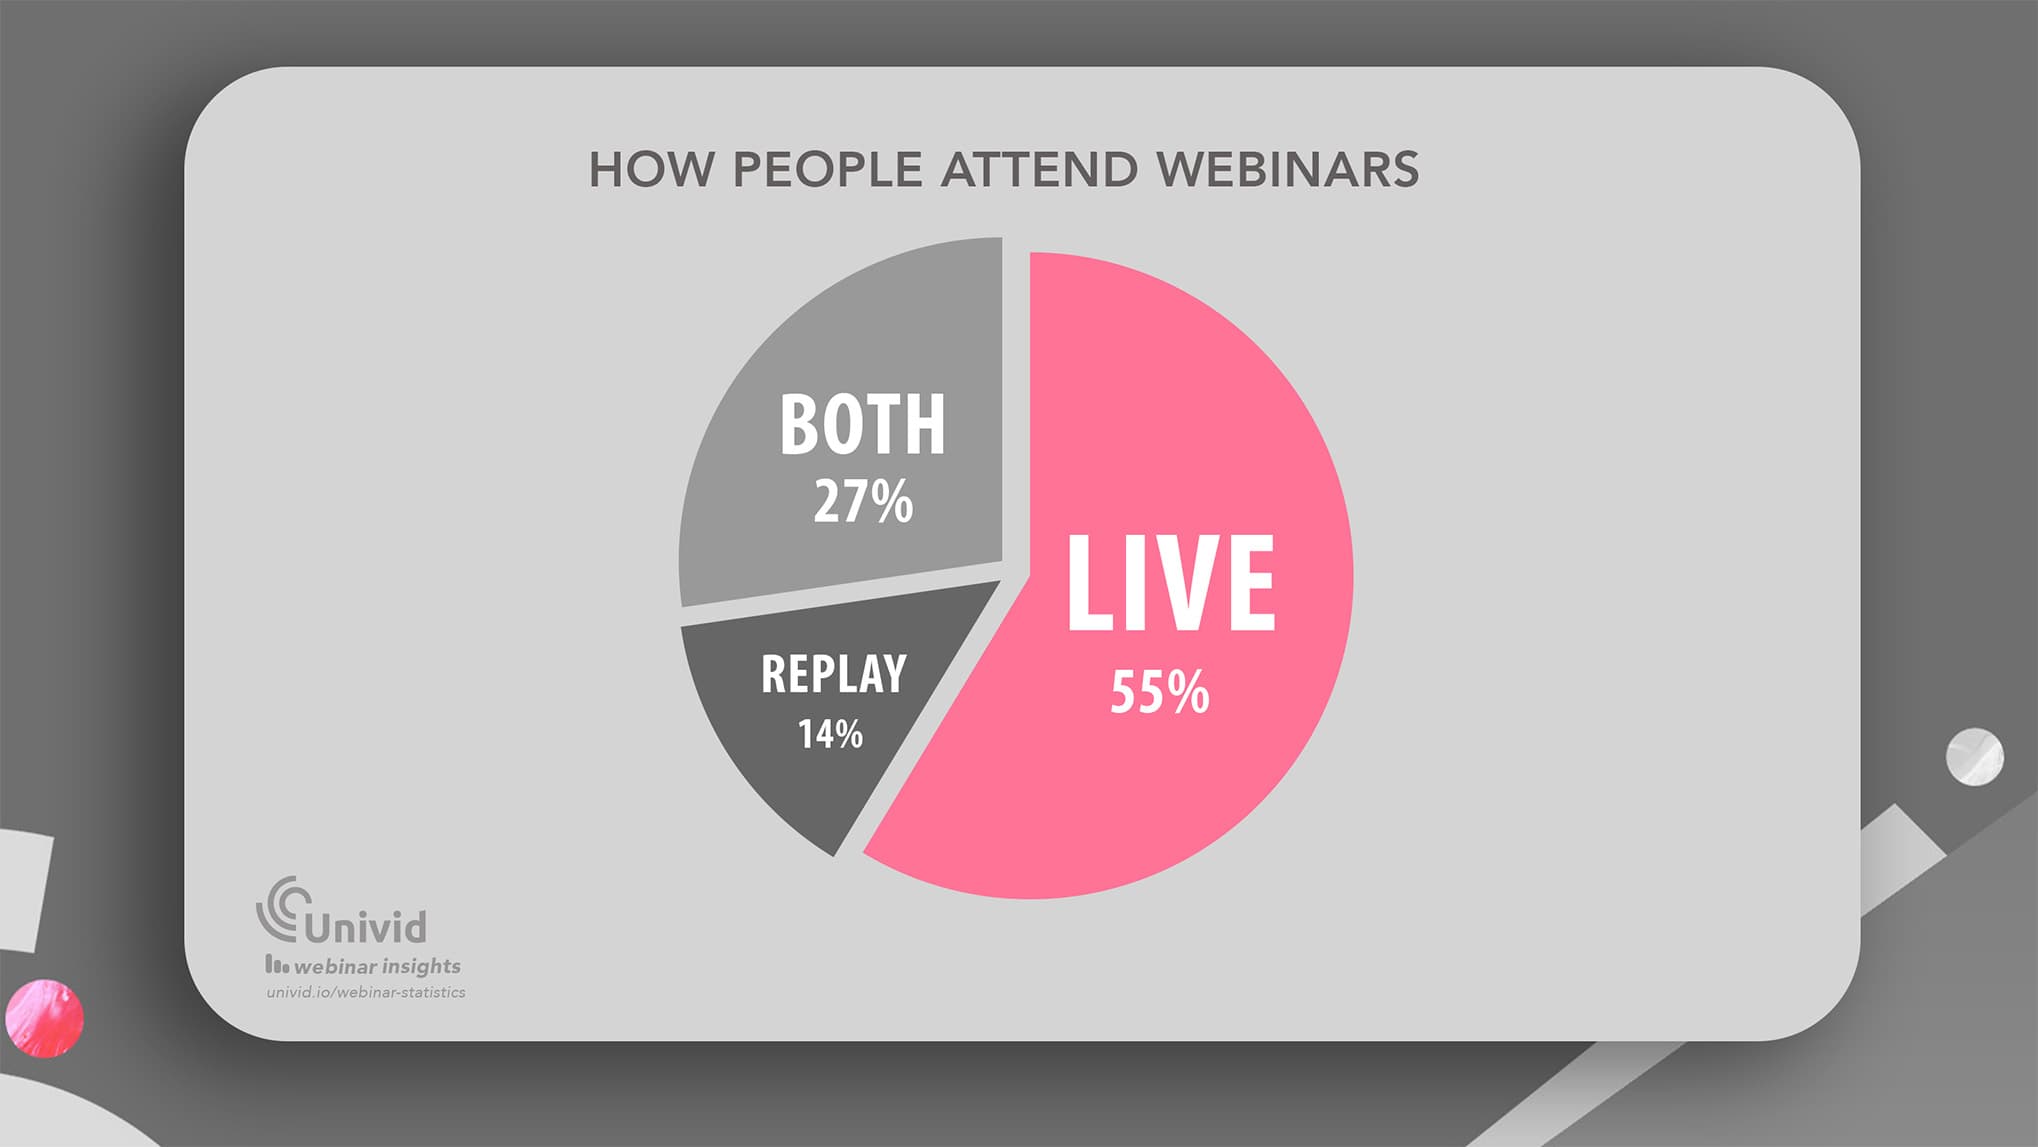
Live is still king. A majority of attendees, more specifically 86% of attendees take part in the live webinar.
Only 24% of attendees only watch the replay, and 14% watch both live and on-demand.
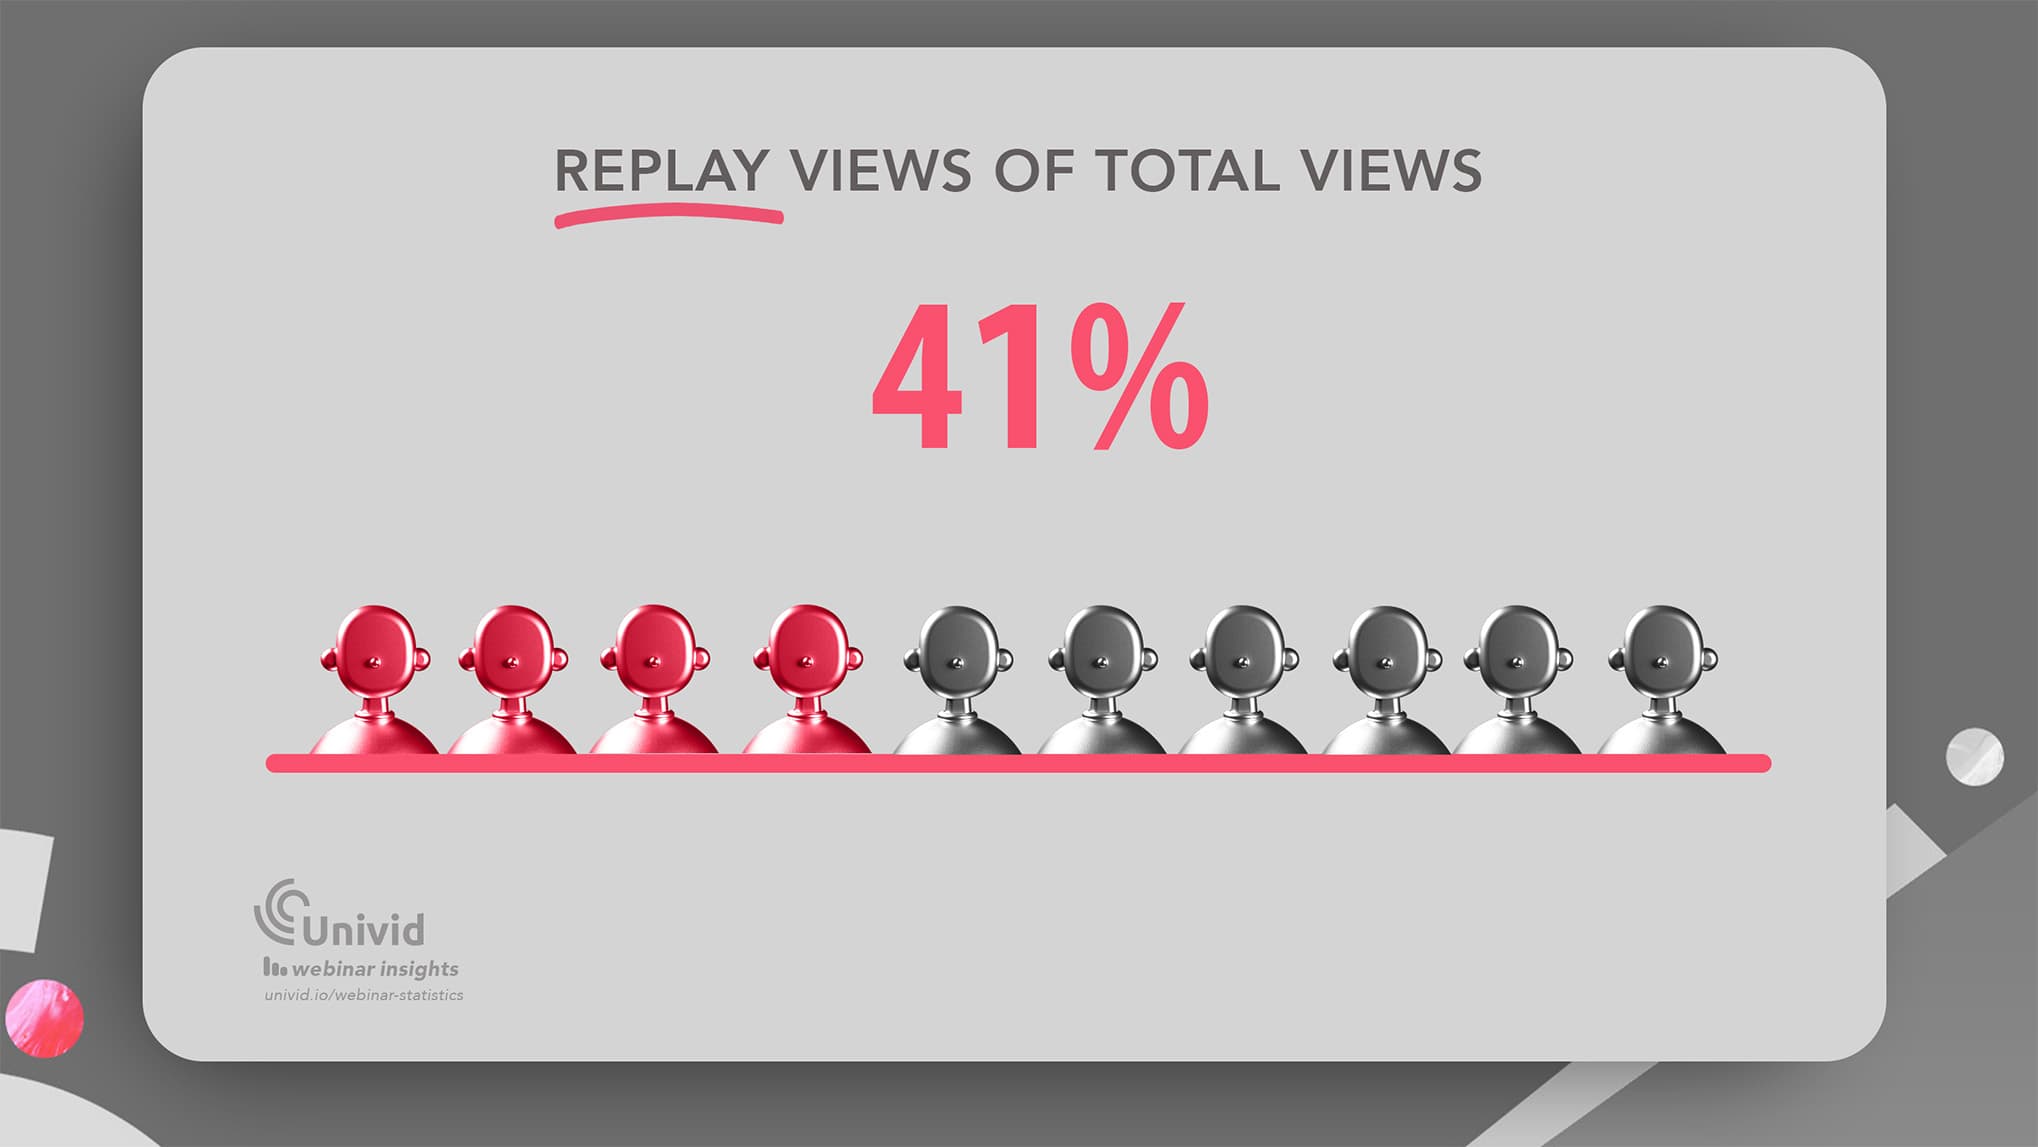
10. 41% of attendees take part of the webinar replay
(Source: Univid Webinar Insights 2026)
Of the attendees, about 4 out 10 watch the replay of the webinar. Either only watching the replay, or both attending live and watching afterwards.
Webinar engagement statistics
In a world where brands are competing for a few seconds of attention on TikTok and LinkedIn. A world where average excellent watch times for shorts can be 10 - 15 seconds, webinars provide a unique way to go in depth - and build relationships.
But how do people engage in webinars? And what type of interaction is typically offered by the hosts? See below webinar statistics on engagement to get the answers, based on analyzing 1000s of webinars.
11. 46% of marketers report audience engagement is a key challenge when running webinars
(Source: HubSpot Marketing Survey)
Webinars with engagement report much higher conversion compared to those without engagement - which we will see in coming stats. Still, in a survey from HubSpot, 46% of marketers report that audience engagement is still the main challenge when running webinars.
There is a clear need for simpler webinar tools to engage and not having to be an expert to do it - when juggling all the other tasks around planning, hosting and executing a webinar.
And that's why we built Univid. Let's learn more webinar engagement.
12. Engagement feature and their popularity in webinars
(Source: Univid Webinar Insights 2026)
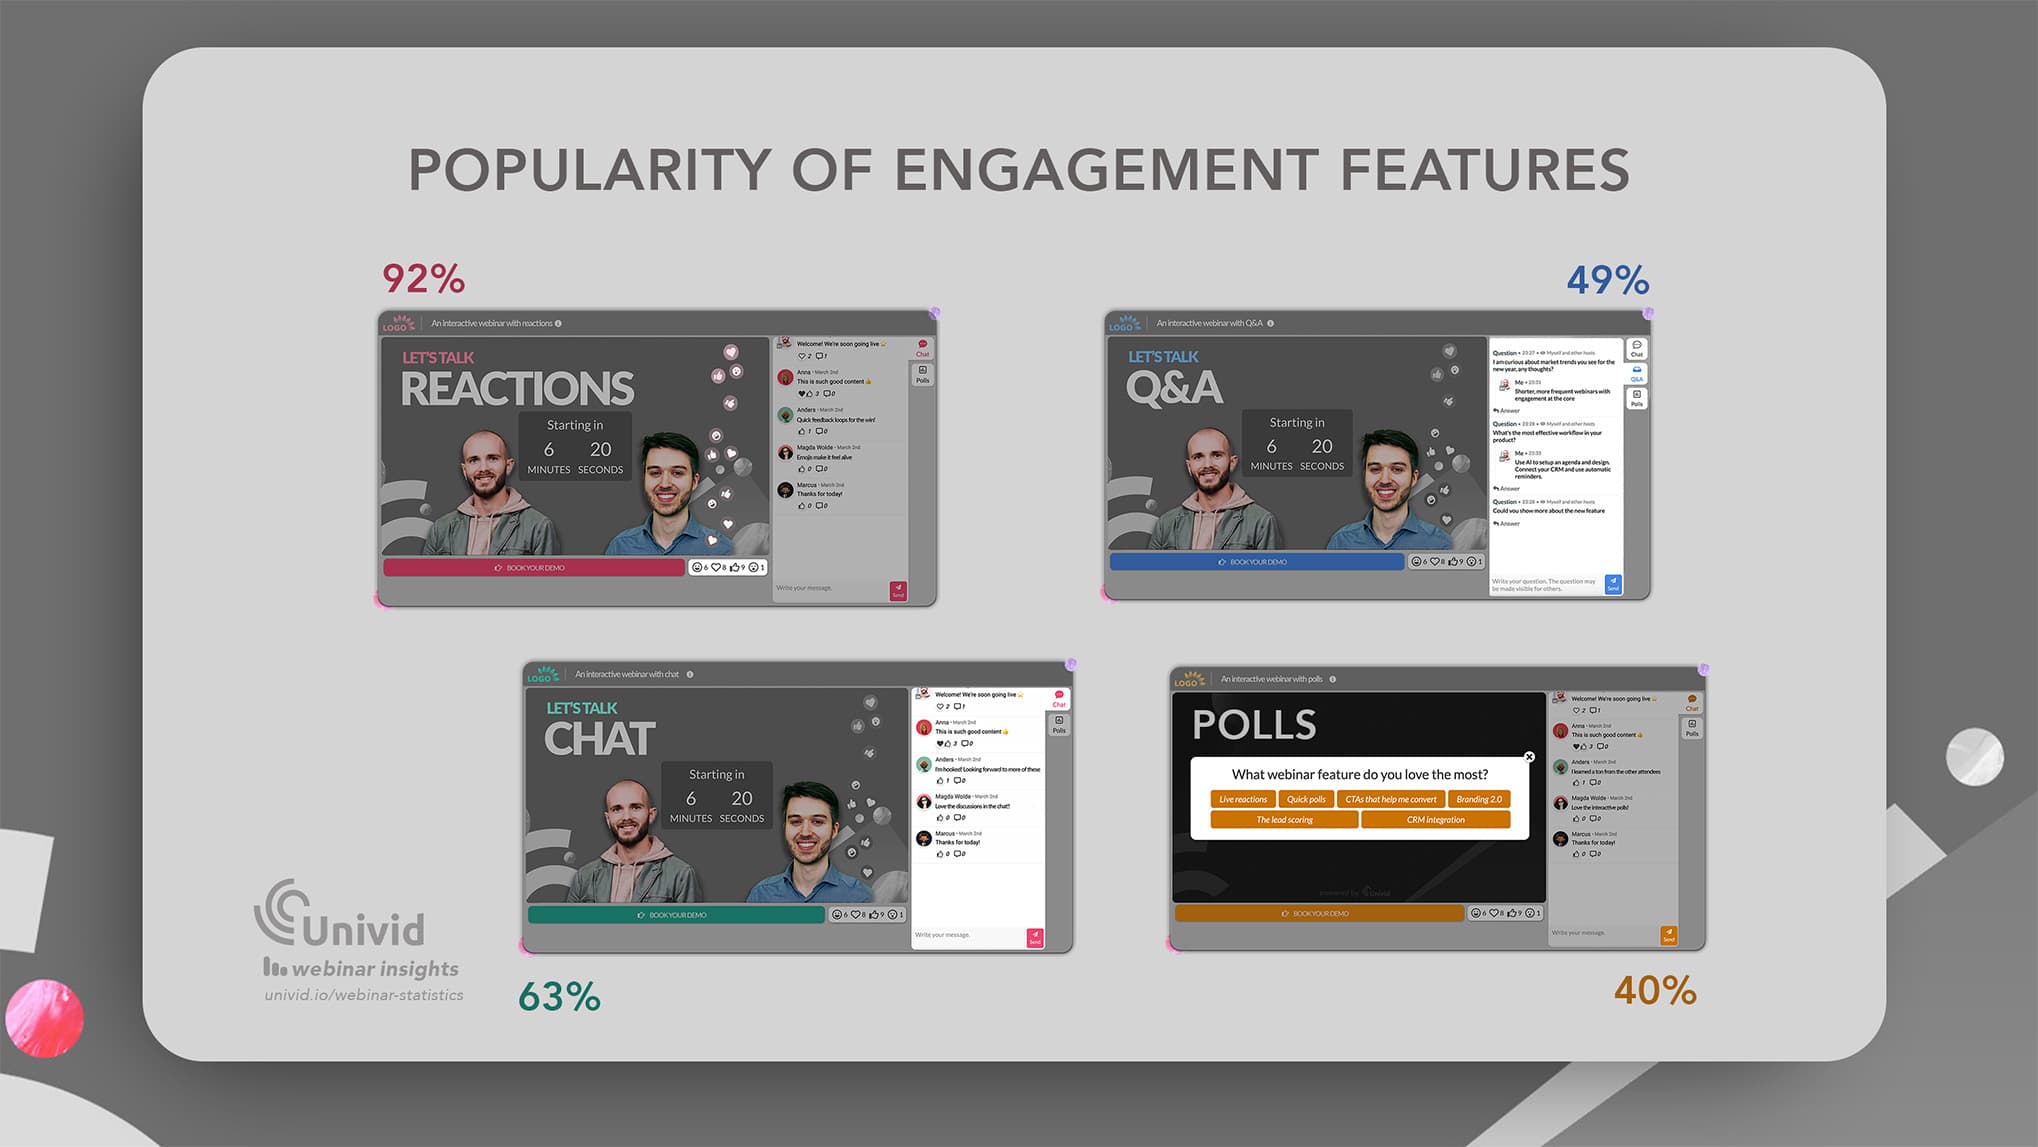
Let's start off with an overview of the engagement features - and how popular they are:
Engagement feature | Popularity |
|---|---|
Live reactions | 92% |
Chat | 63% |
Q&A | 49% |
Polls | 40% |
13. Live reactions are the most popular way to engage (92%)
(Source: Univid Webinar Insights 2026)
What are the most popular webinar engagement feature?
Well, modern webinar hosts love to use live reactions - with 92% of webinars having them active.
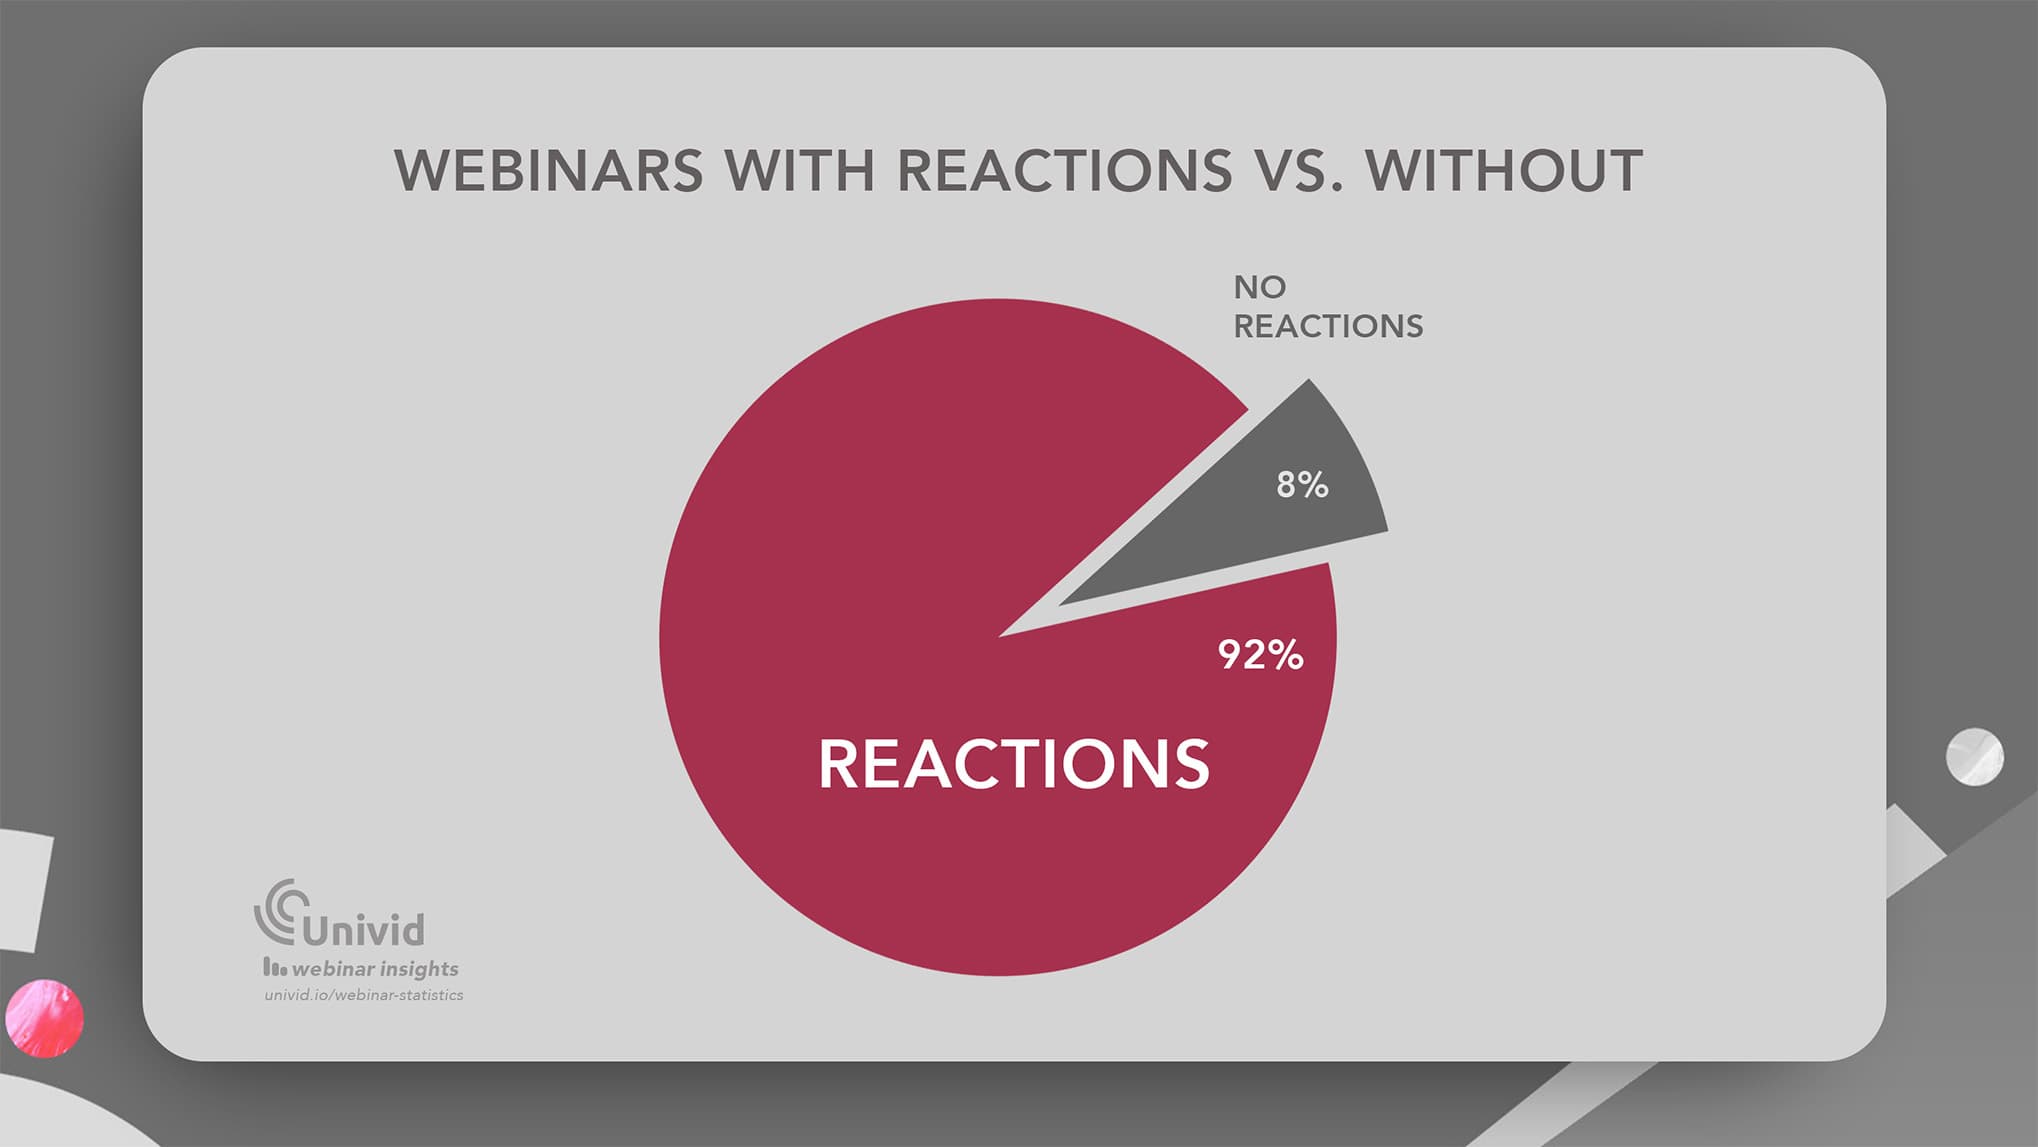
Live reactions are great for quick polling, getting feedback, activating the attendees, and making use of the live format.
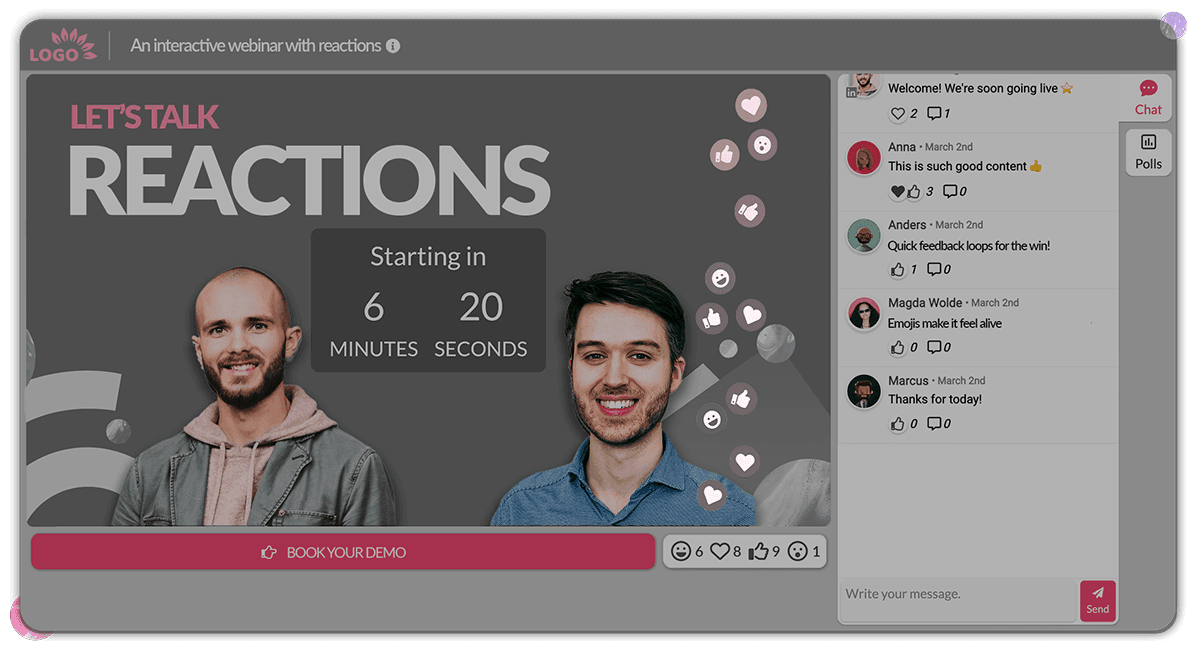
Compared to 63% that use the chat, 49% that use Q&A, and 40% that run polls.
14. 63% of webinars have a chat
(Source: Univid Webinar Insights 2026)
A majority of webinars have a chat active (63%), compared to not having one (37%).
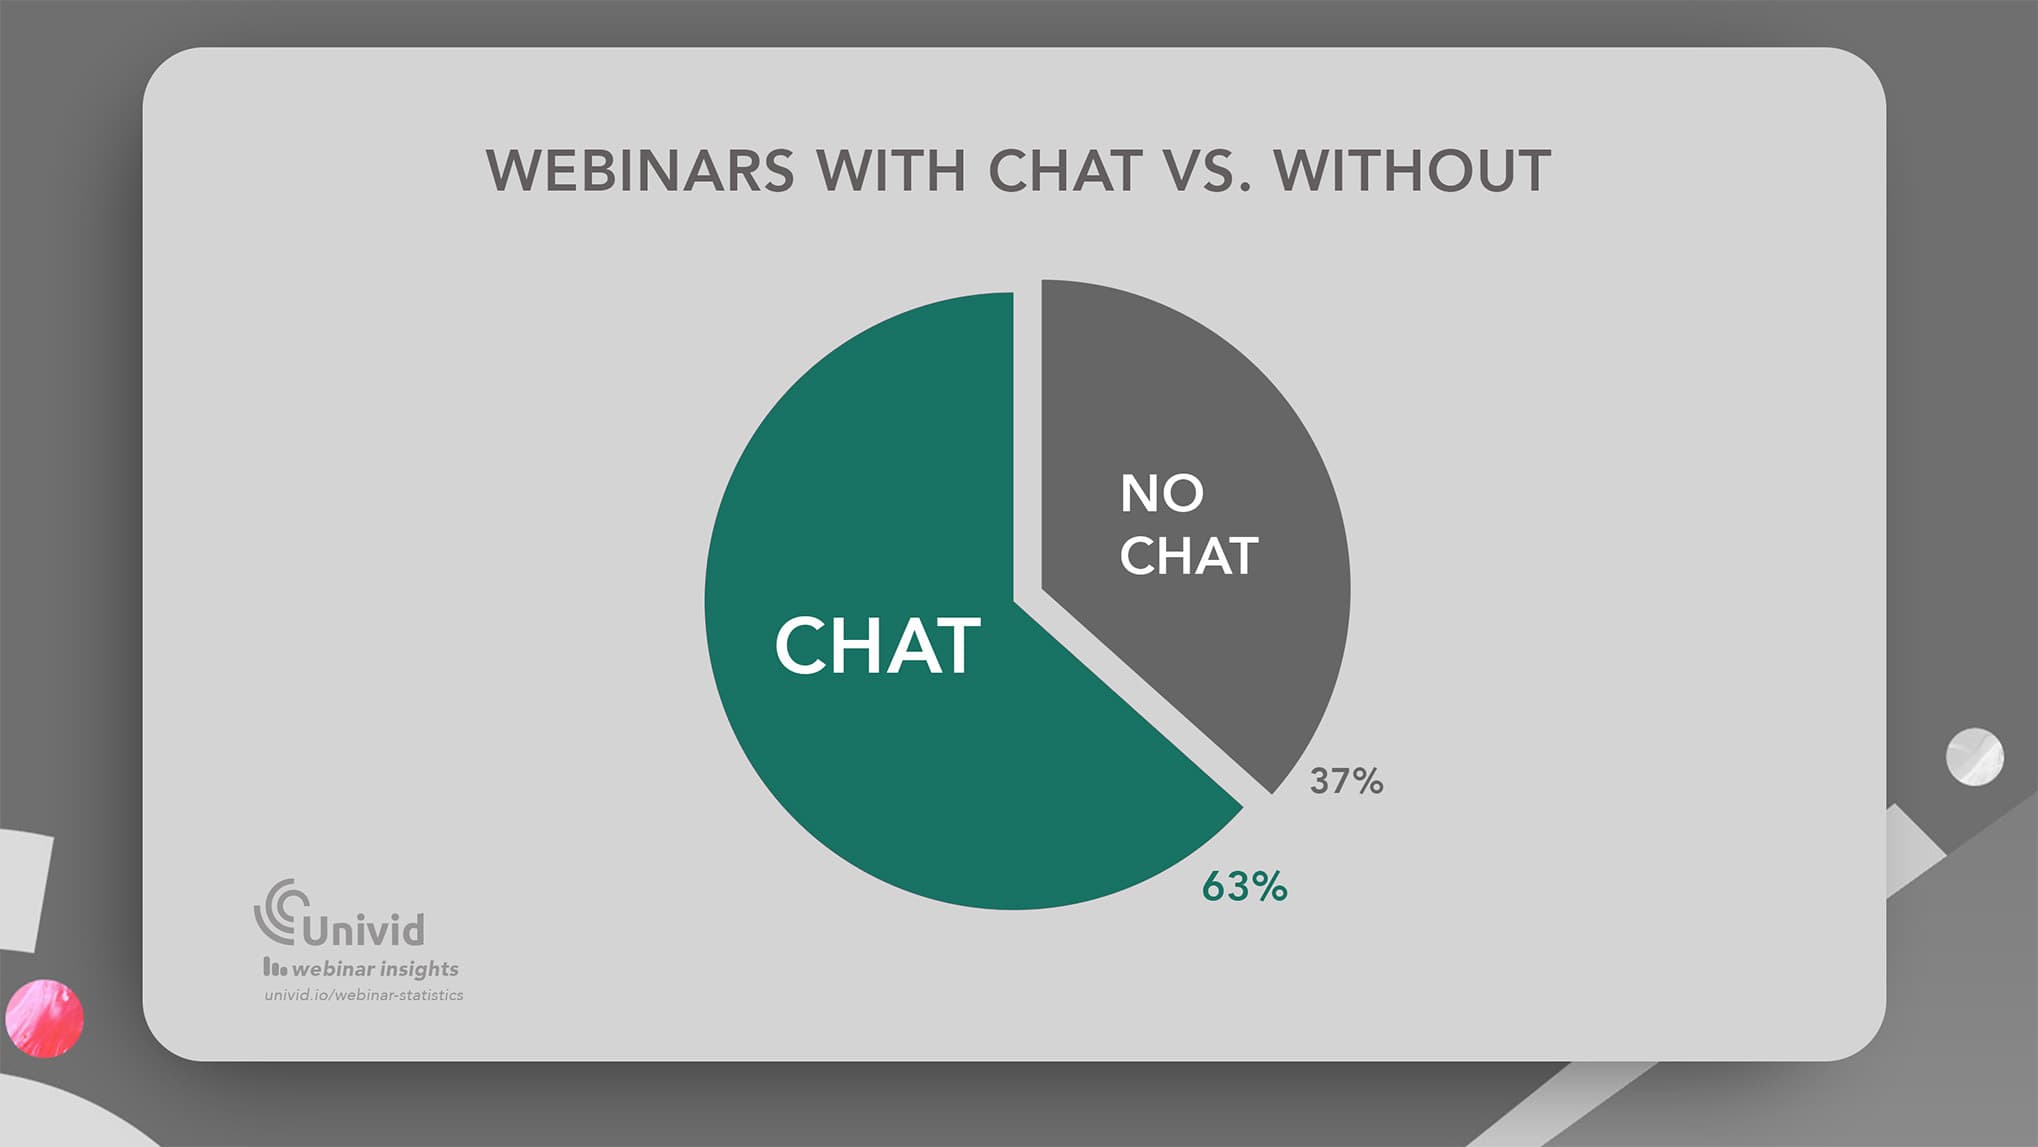
The chat is a transparent and open, where everyone can see what is written and attendees can ask question, discuss amongst each other, and engage. It suits webinars where it's focus on community. Otherwise, a Q&A might be effective.

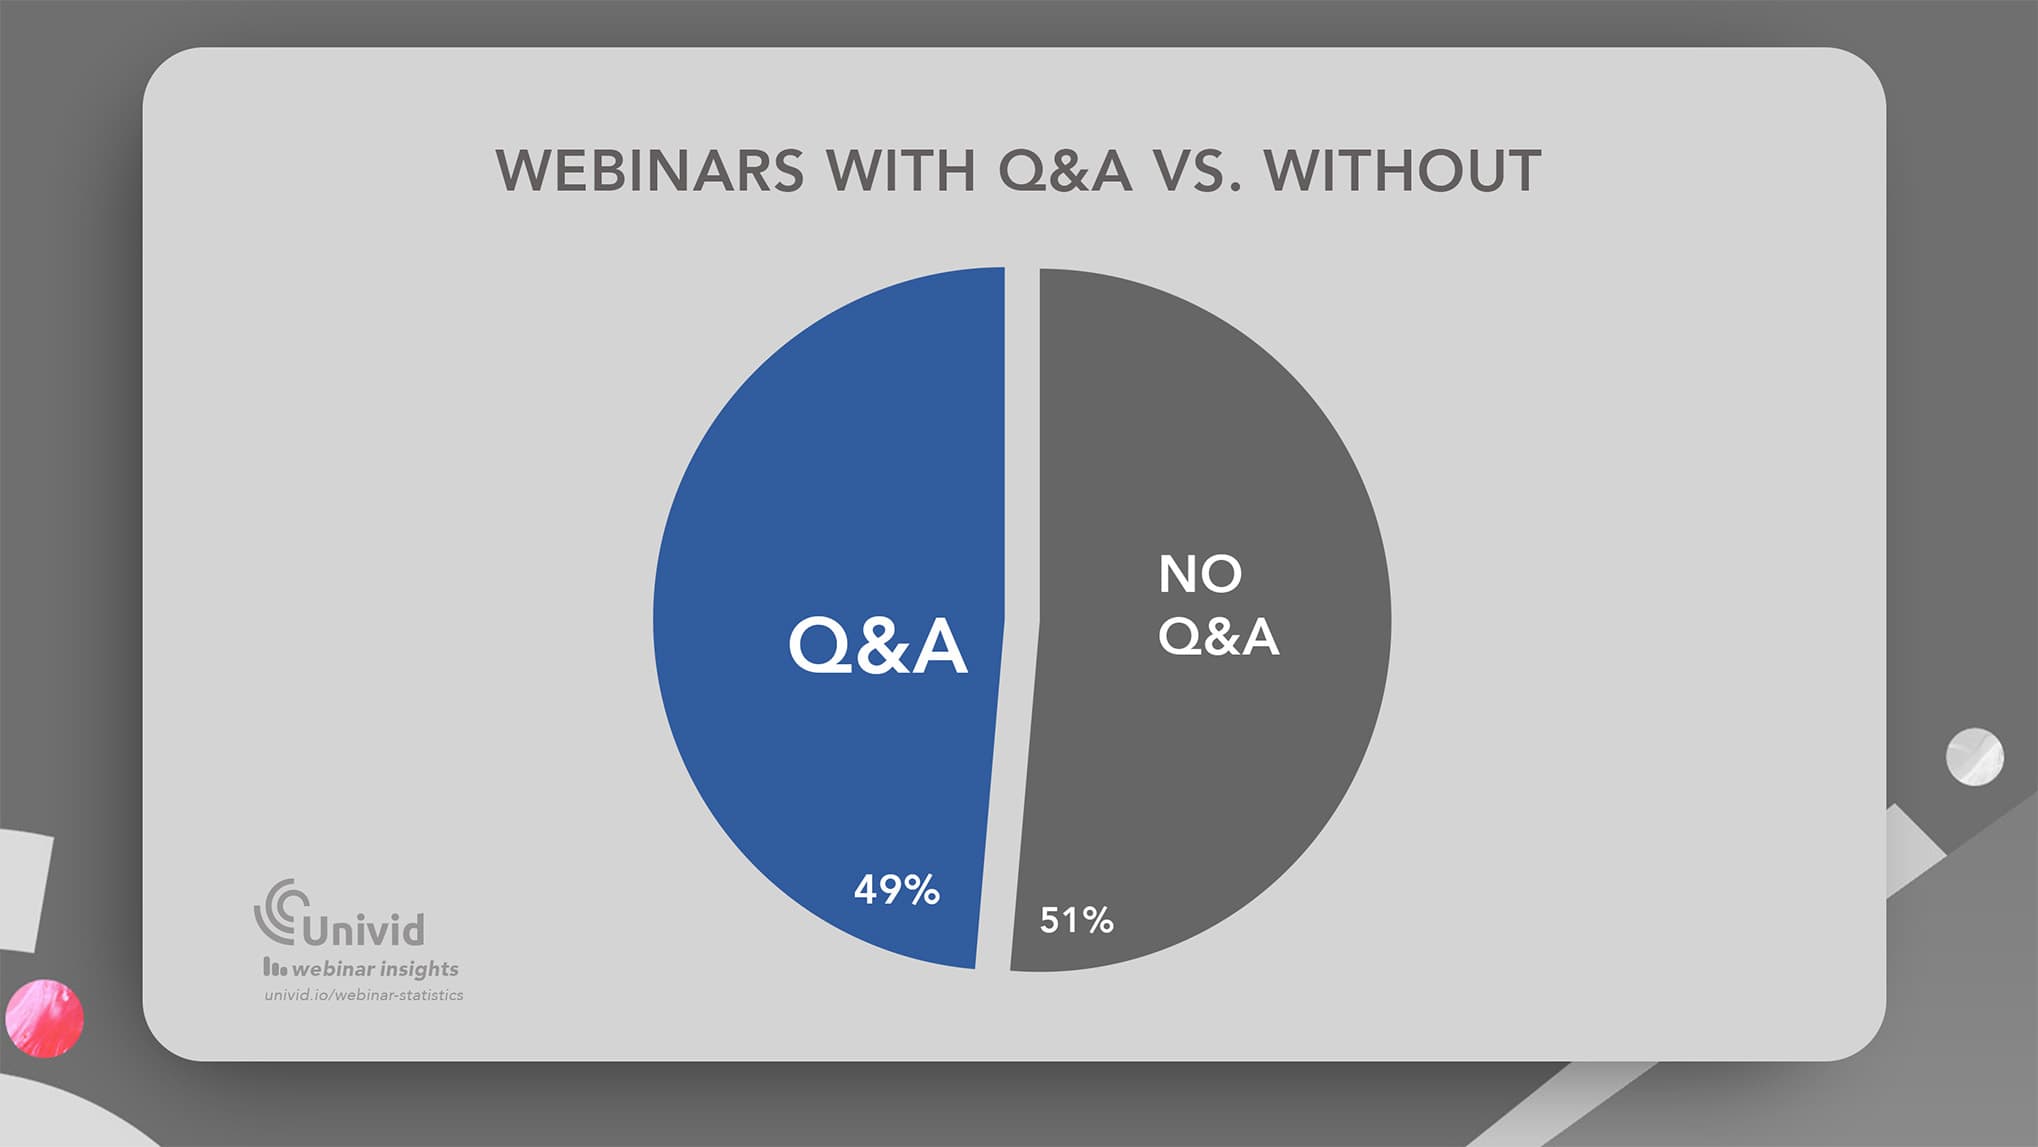
15. Q&A is used in 49% of webinars
(Source: Univid Webinar Insights 2026)
About half of all hosted webinars (49%) incorporate a Q&A.
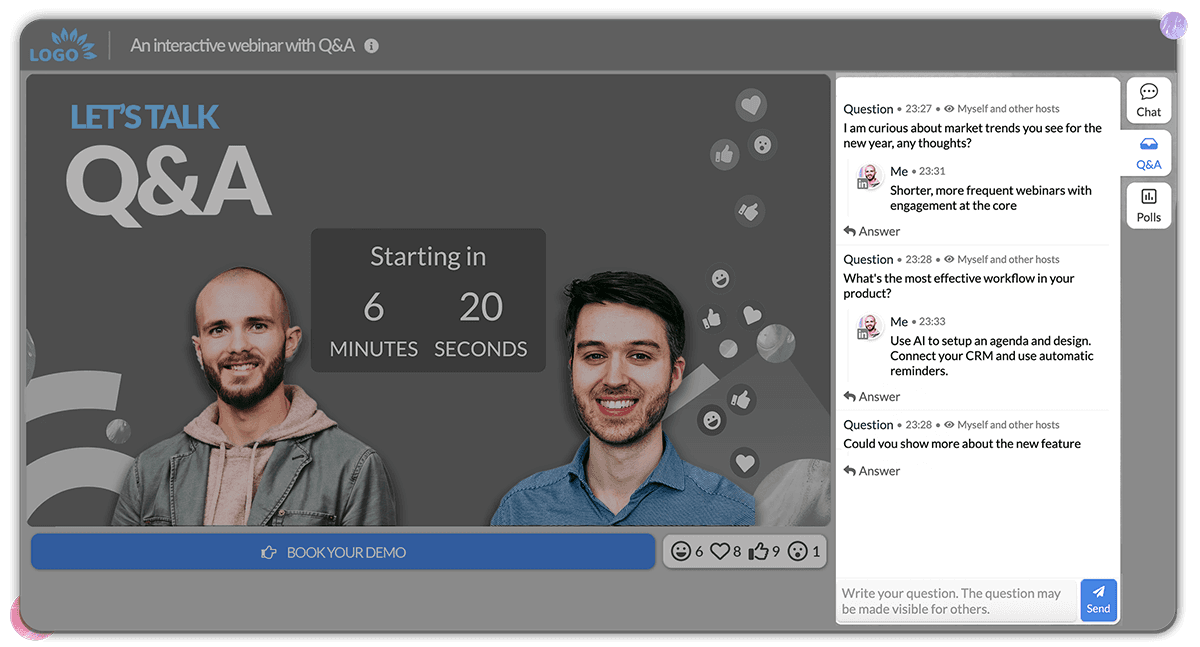
The Q&A is great to keep structured questions and answers, where you can pin questions, hide the answers from attendees by default, and get structure. Suiting webinars facing external clients. For example - where sensitive questions are expected, or attendees might be competitors.
16. 40% of webinars use polls
(Source: Univid Webinar Insights 2026)
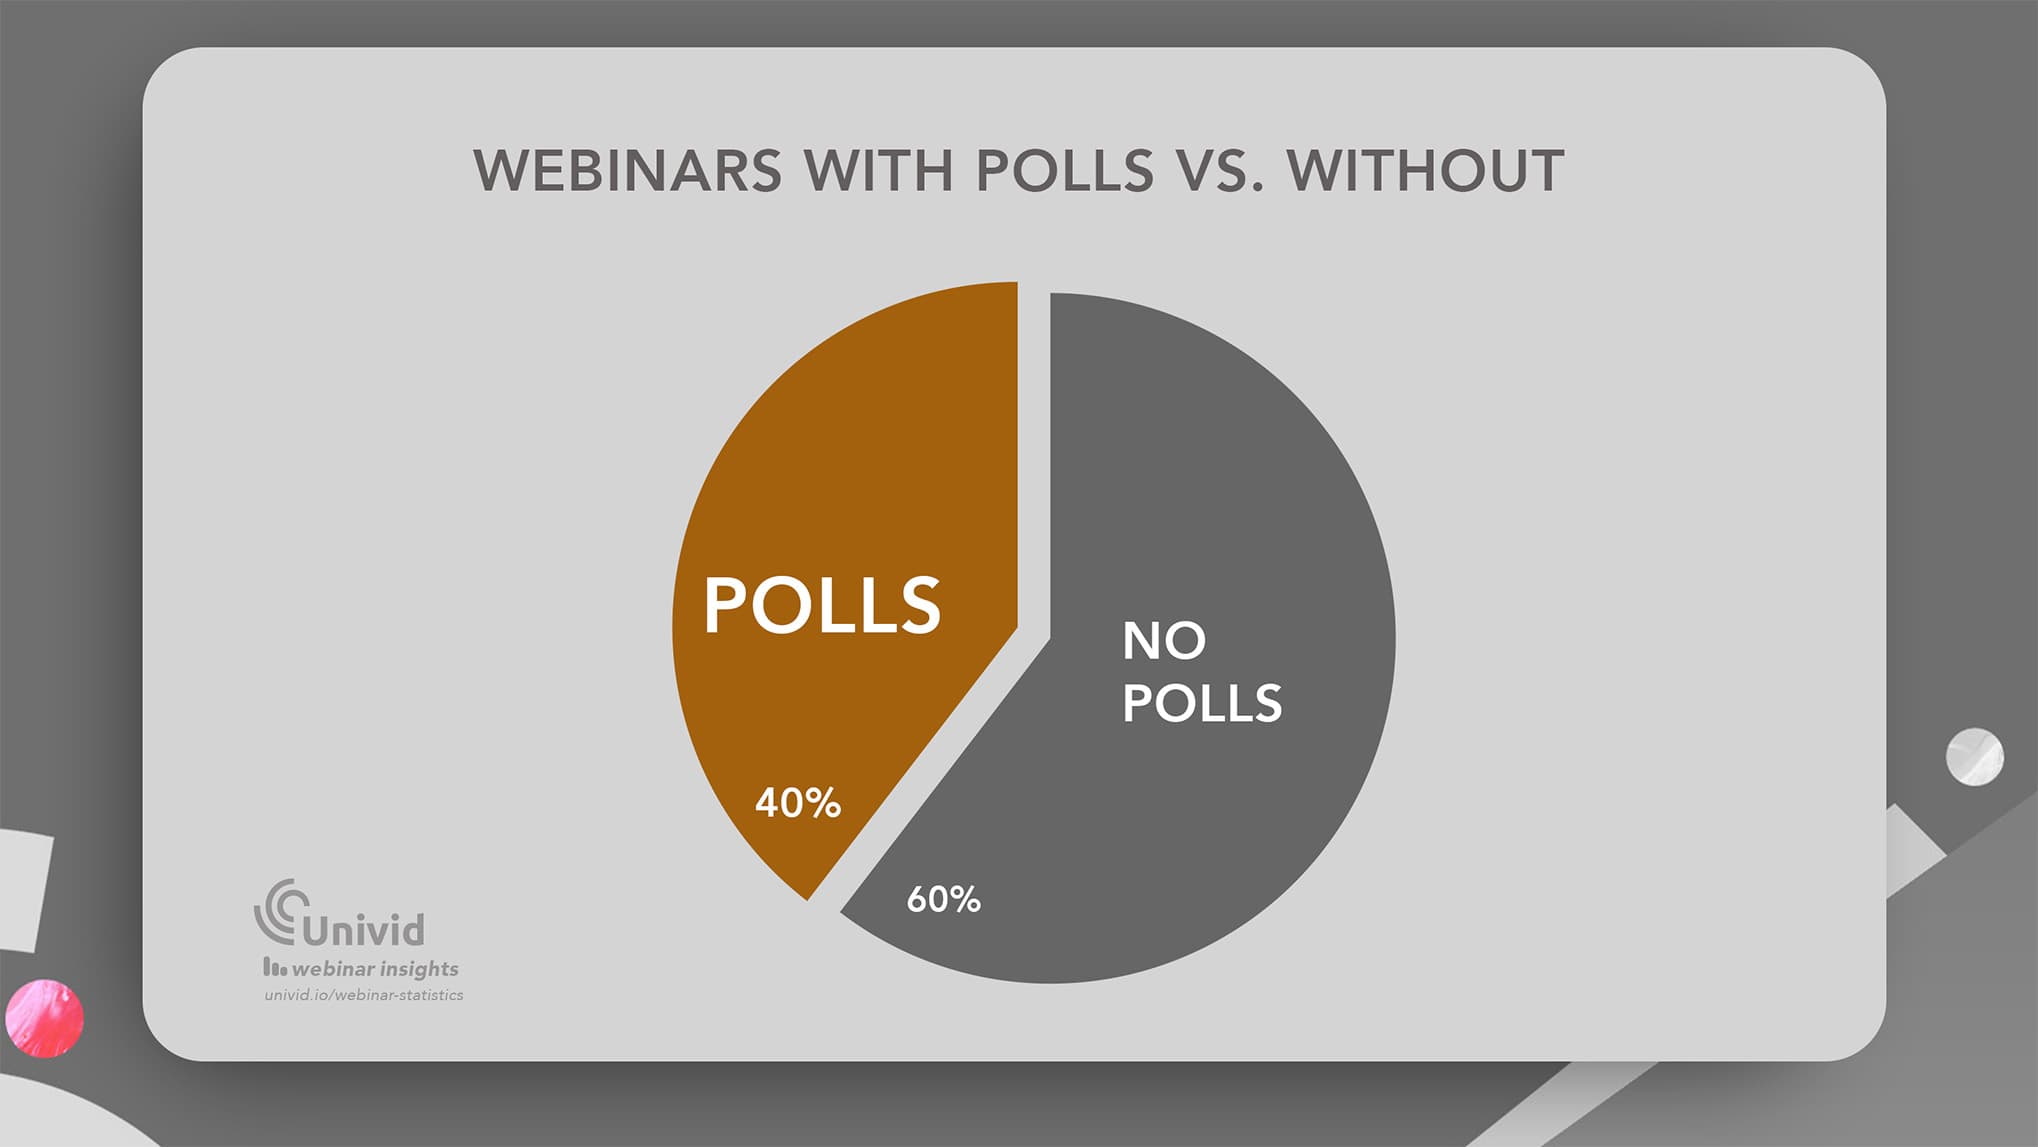
40% of webinars have polls active - either using them as way of gathering feedback, put together insights, or activating the audience.
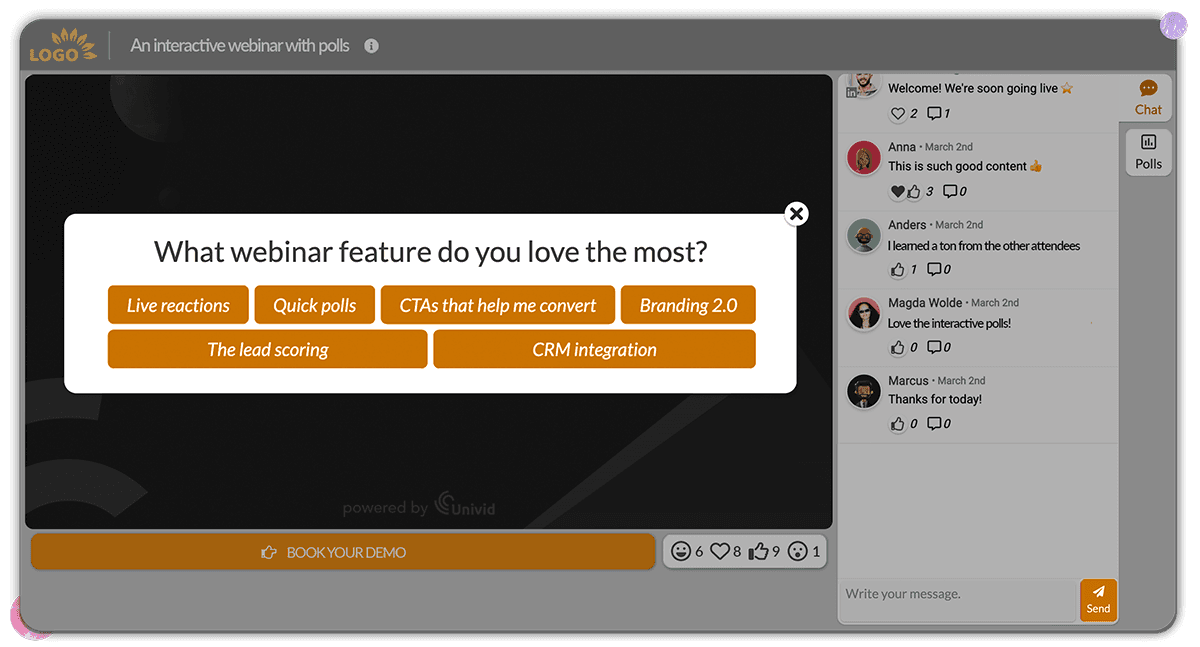
Polls can be make a big impact on webinar conversion, data shows - if you ask the right questions. But polls also drive valuable insights that can lay ground for what to talk about in upcoming webinars, carving out your ICP, or repurposing to social media, blogs, or e-books.
17. The highest CTA conversion (33%) occurs when all engagement features are active
(Source: Univid Webinar Insights 2026)
Webinars with polls, live reactions, chat, Q&A enabled show the highest webinar CTA conversion: 33%.
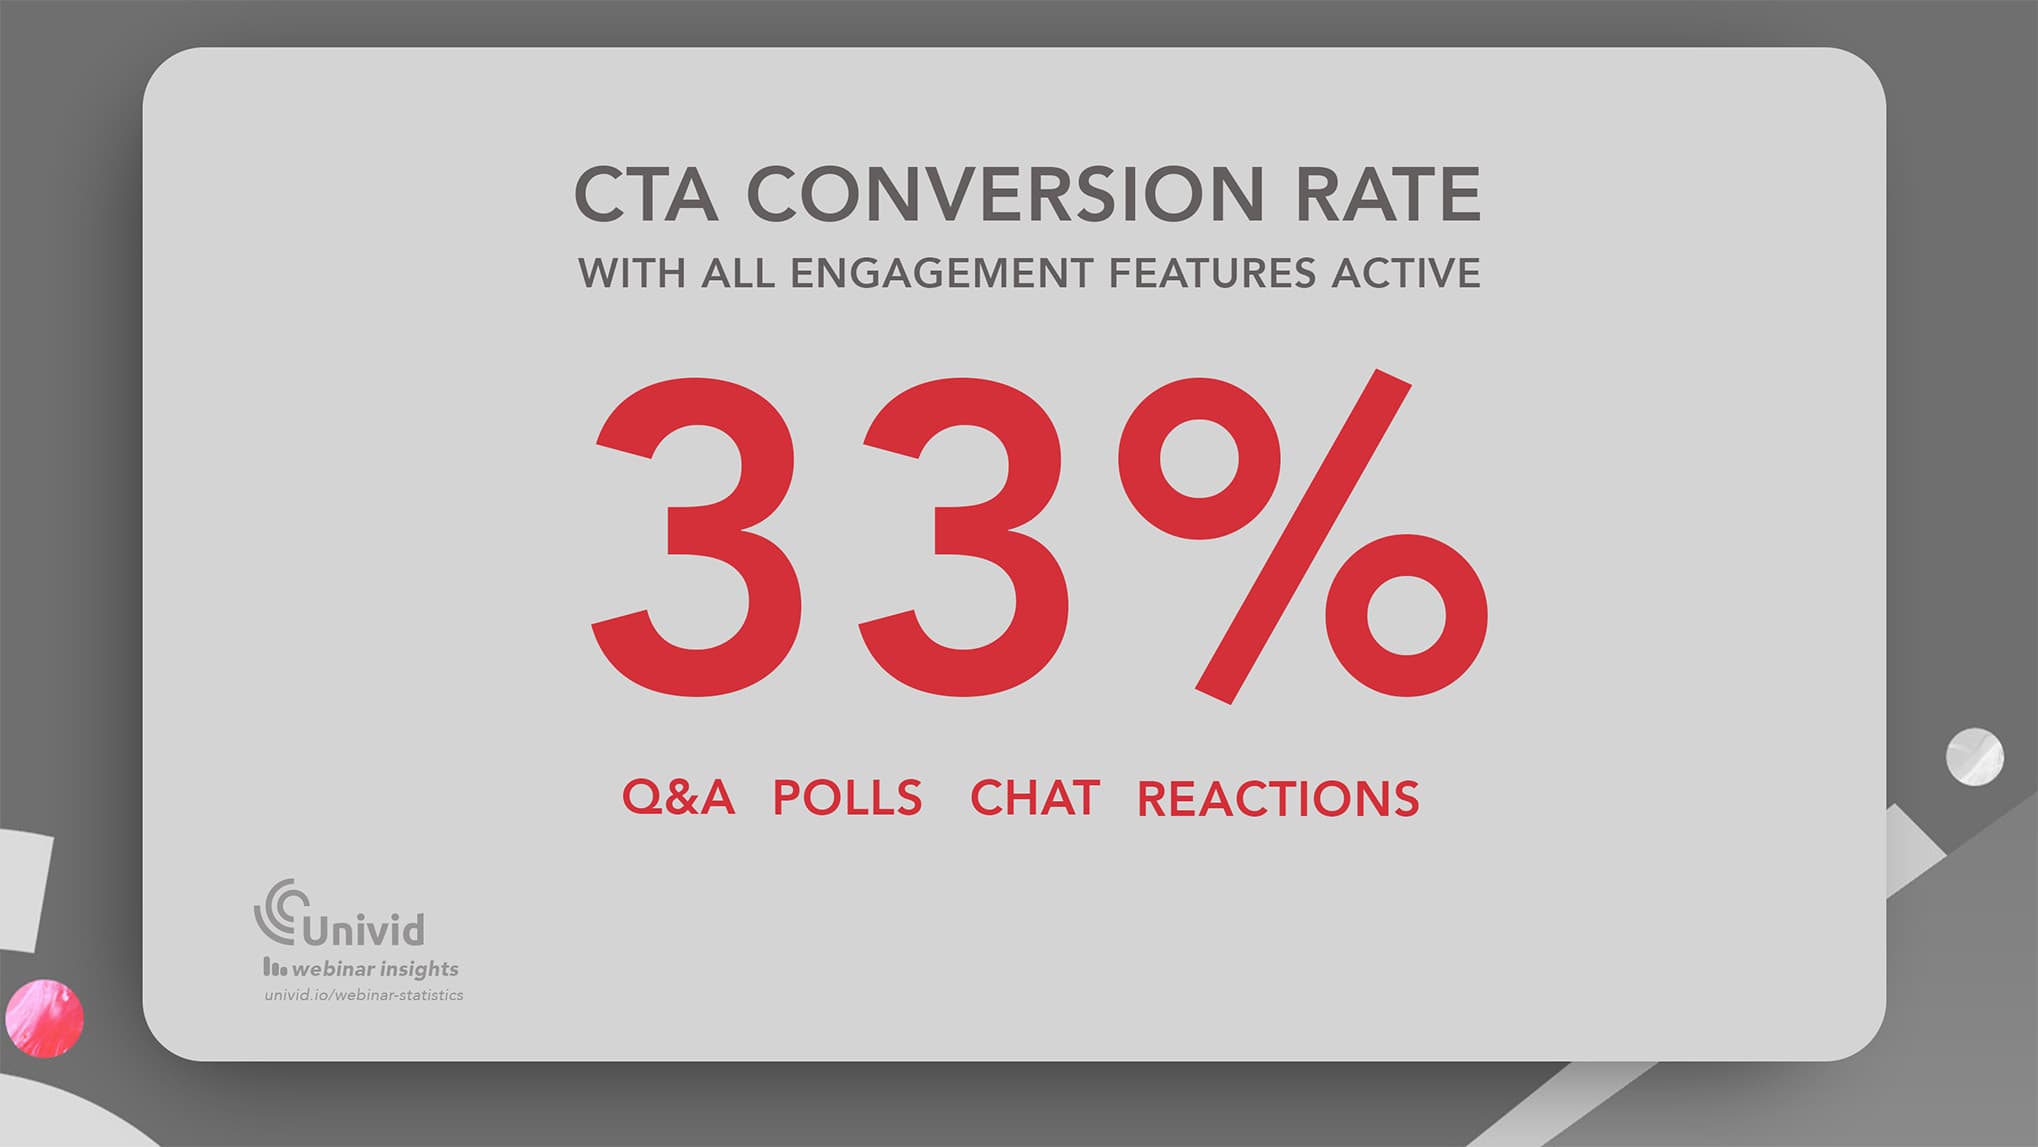
Meaning offering the attendees more opportunities to engage, seem to positively effect the likeliness of the attendees also converting using the CTA.
18. Webinars with more live reactions see higher CTA conversion
(Source: Univid Webinar Insights 2026)
Data shows that engaged attendees convert to next steps substantially more, compared to attendees that are not engaged.
More specifically, webinars that have on average 0 - 1 reactions per attendee have an average of <20% CTA conversion rate, compared to webinars that have on average 5 - 10 reactions per attendee result in a 69% CTA conversion rate.
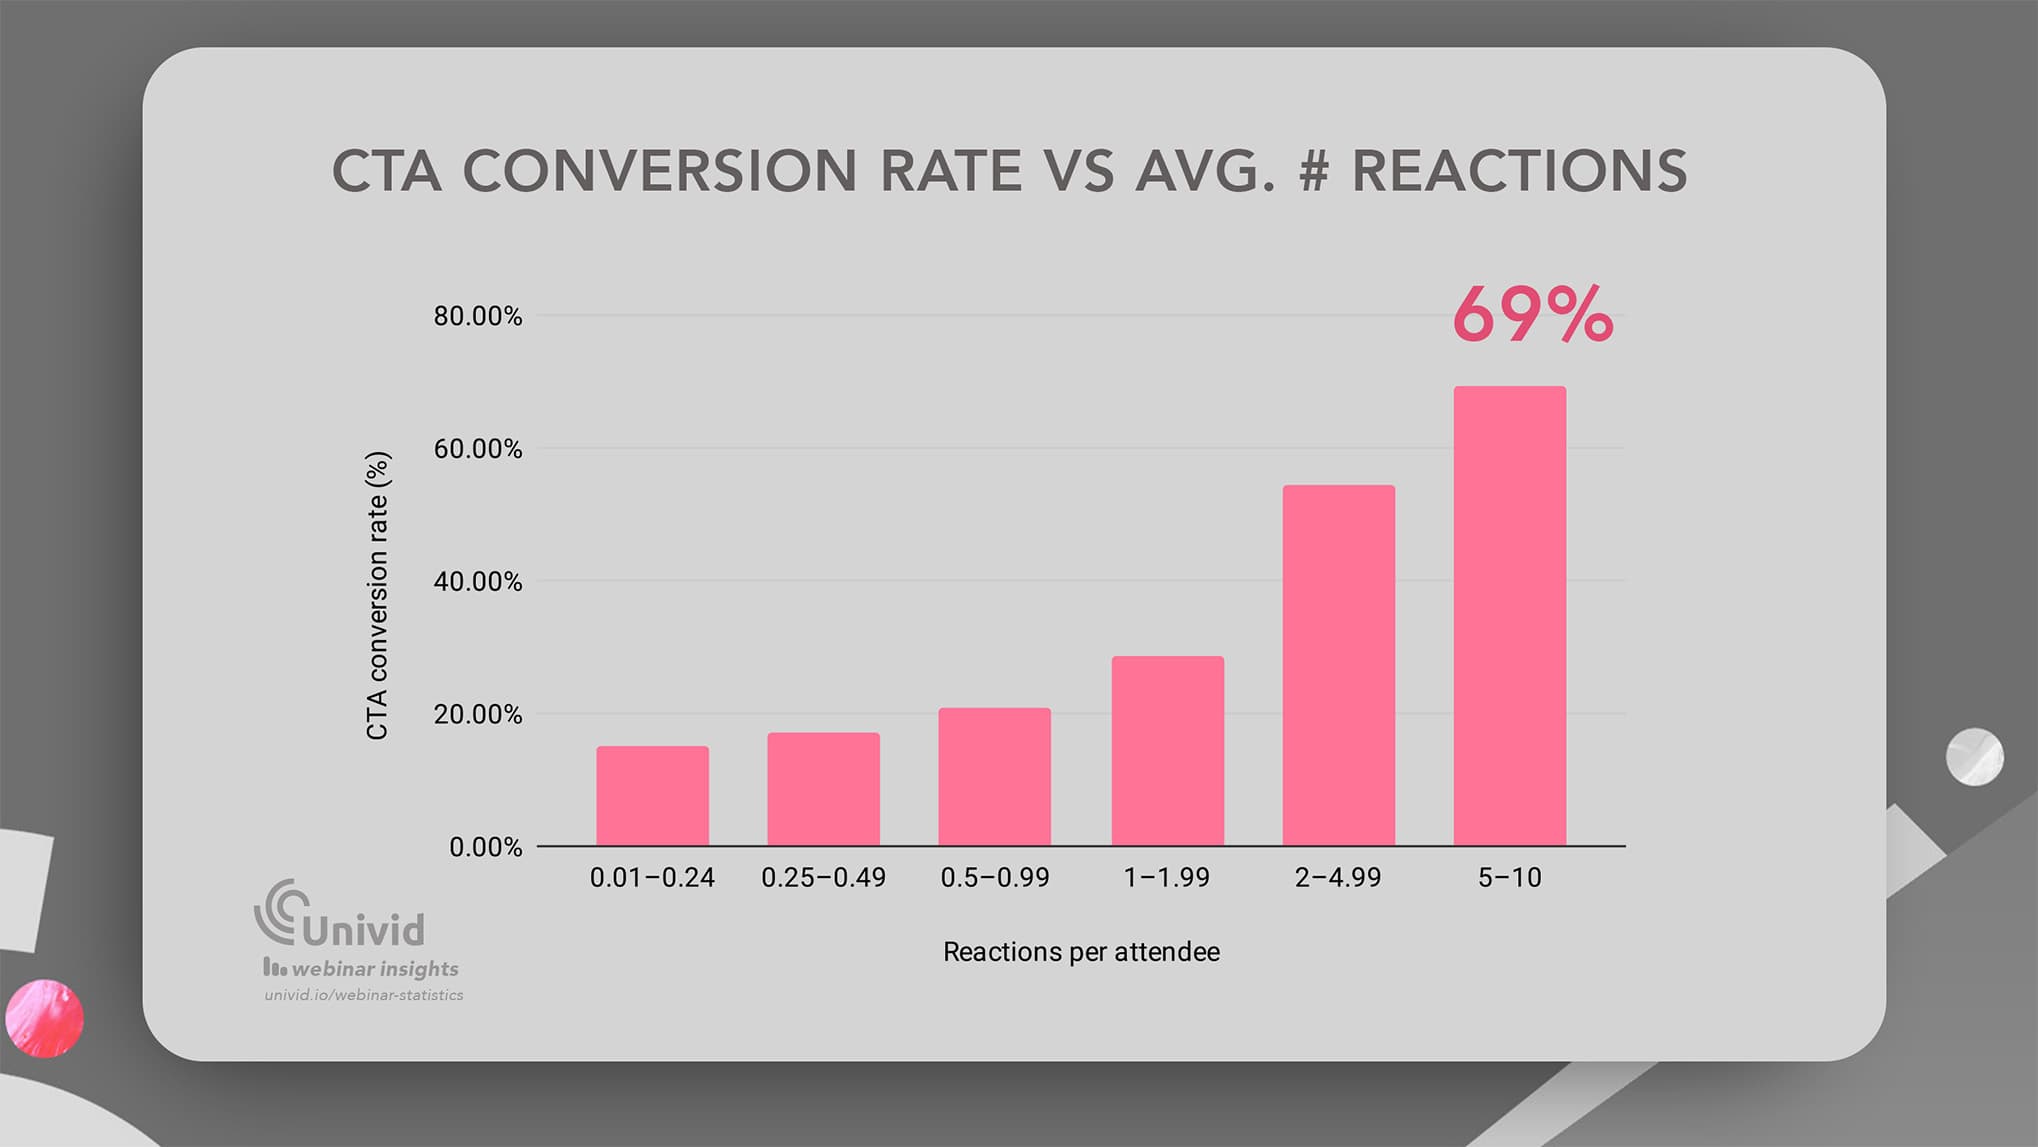
In short: the more live reactions per attendee -> the higher CTA conversion rate.
Webinar conversion & ROI statistics
A good webinar can mean several things. Typically it means achieving conversions toward some goal. Having many curious attendees ask questions, engage, and take a desired next step - for example clicking your webinar CTA.
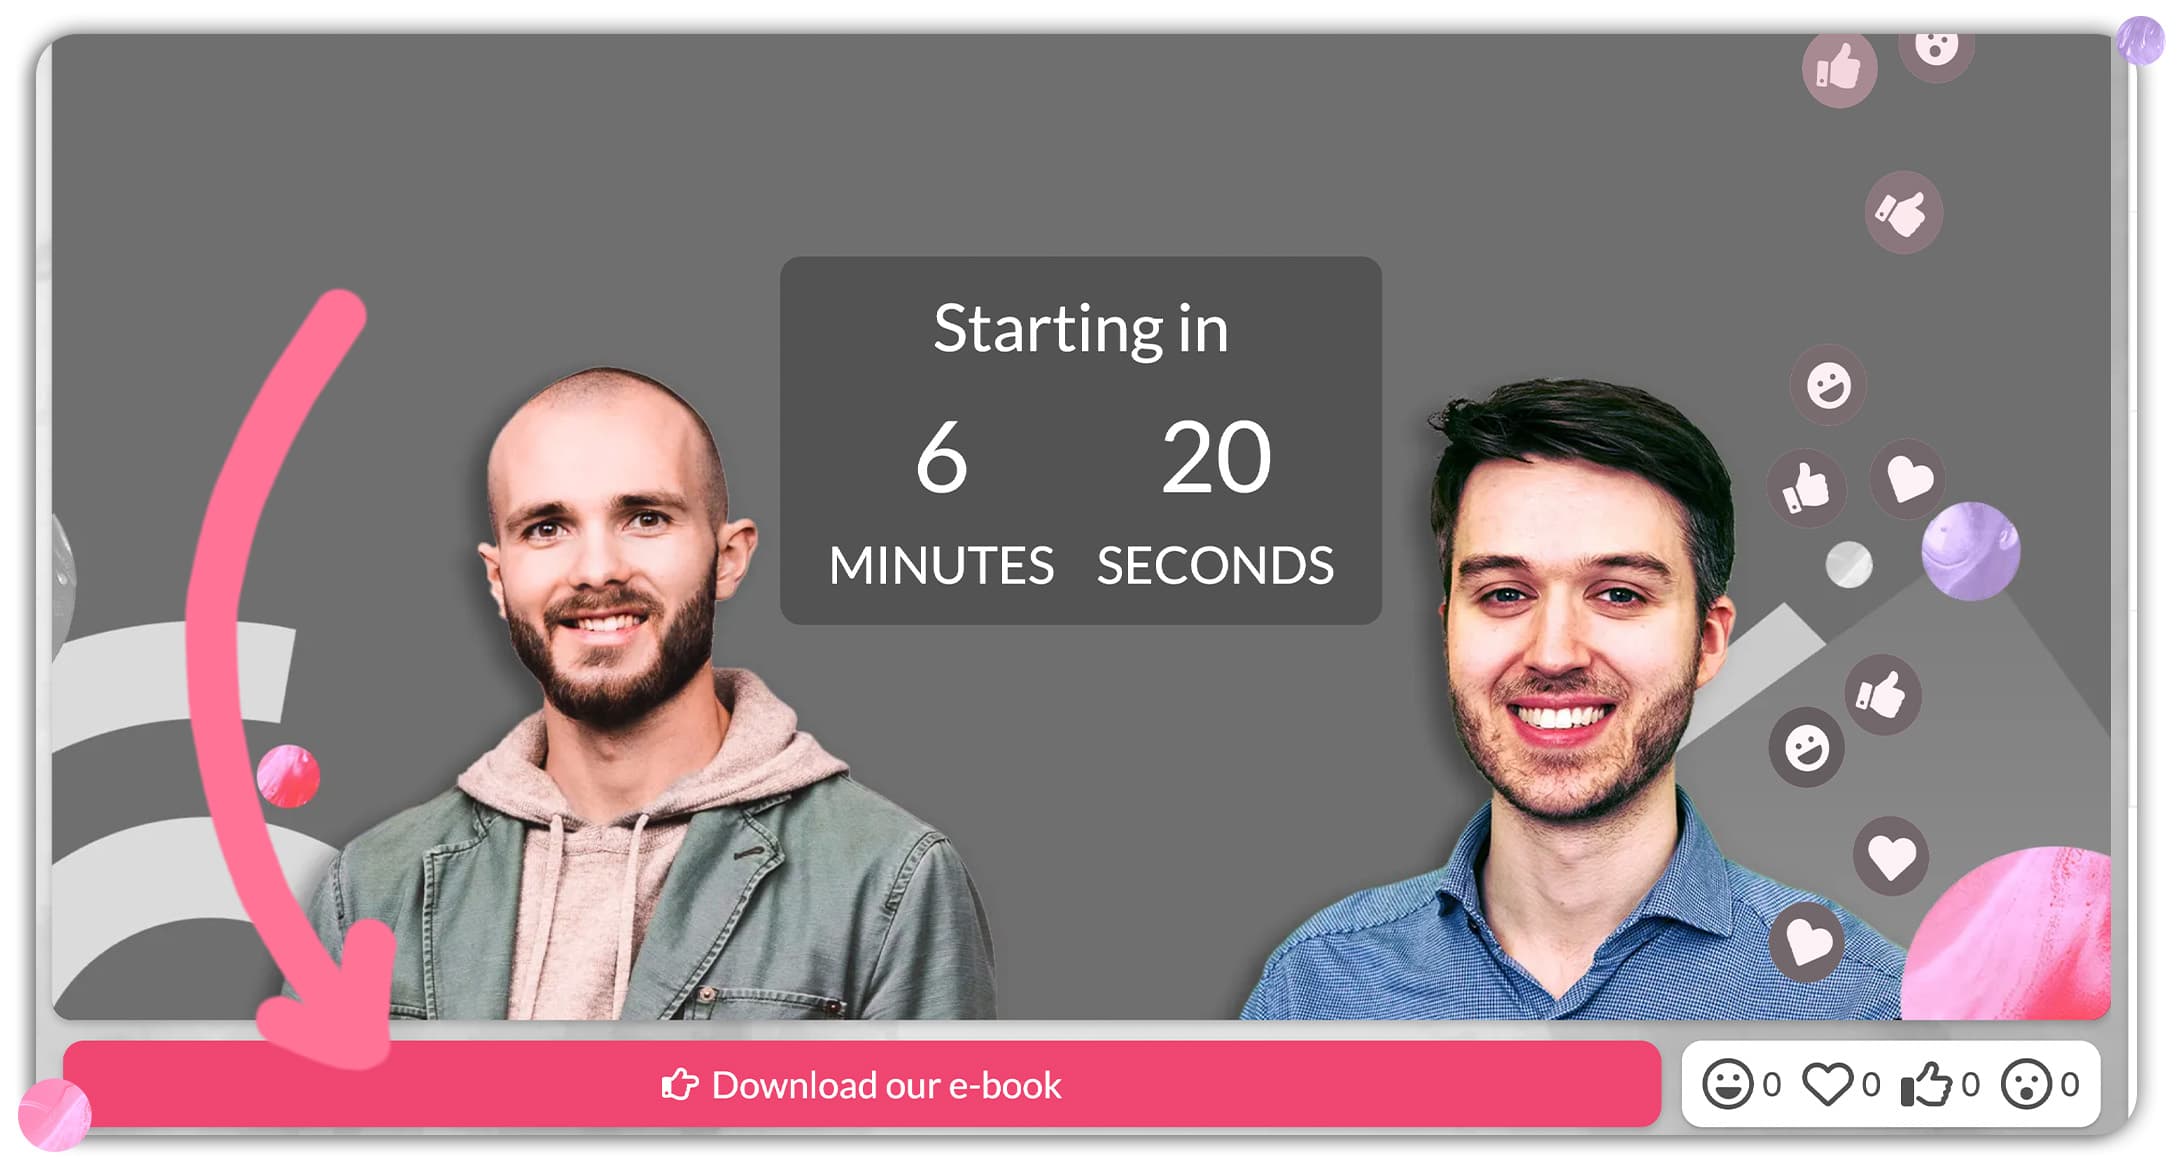
CTA Conversion rate = Proportion of attendees that clicked any of your CTA buttons.
19. 42% of marketers use webinars specifically for lead generation
(Source: HubSpot Marketing Survey)
Most, if not all webinars have a next step - whether it's to generate new leads, or nurturing existing customers.
In a survey conducted by HubSpot, 42% of marketers reported using webinars specifically for lead generation.
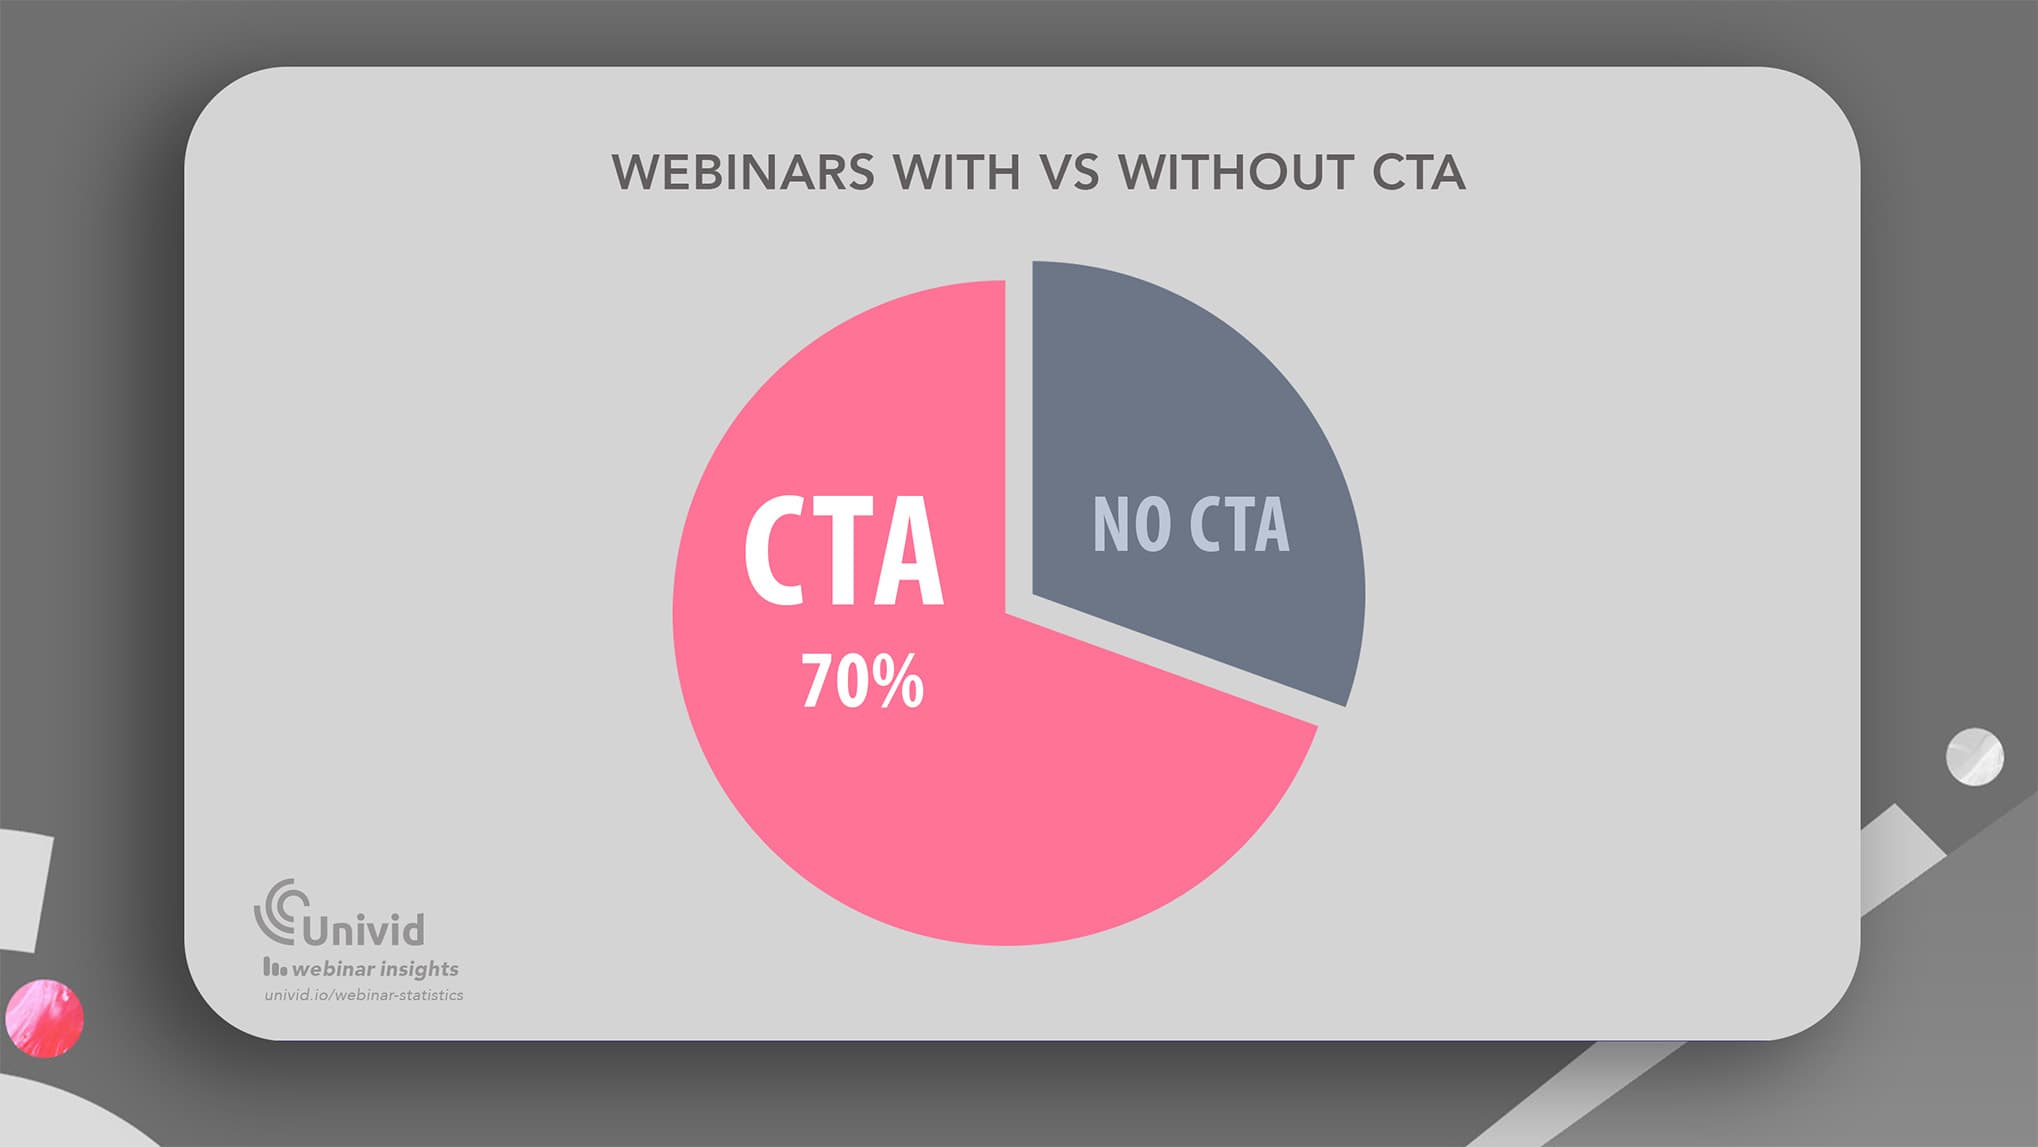
20. 70% of webinars has CTA active
(Source: Univid Webinar Insights 2026)
A majority of the +2000 webinars in this Univid dataset had a CTA button active (70%). Only 30% of webinars did not have an explicit CTA button active. Showing that hosts generally understand the important of clear next steps, and use them to their advantage.
21. The average conversion rate on CTA is 22%
(Source: Univid Webinar Insights 2026)
Across all webinars with a CTA button active, data shows that the average conversion rate from attendee to clicked CTA is 22%.
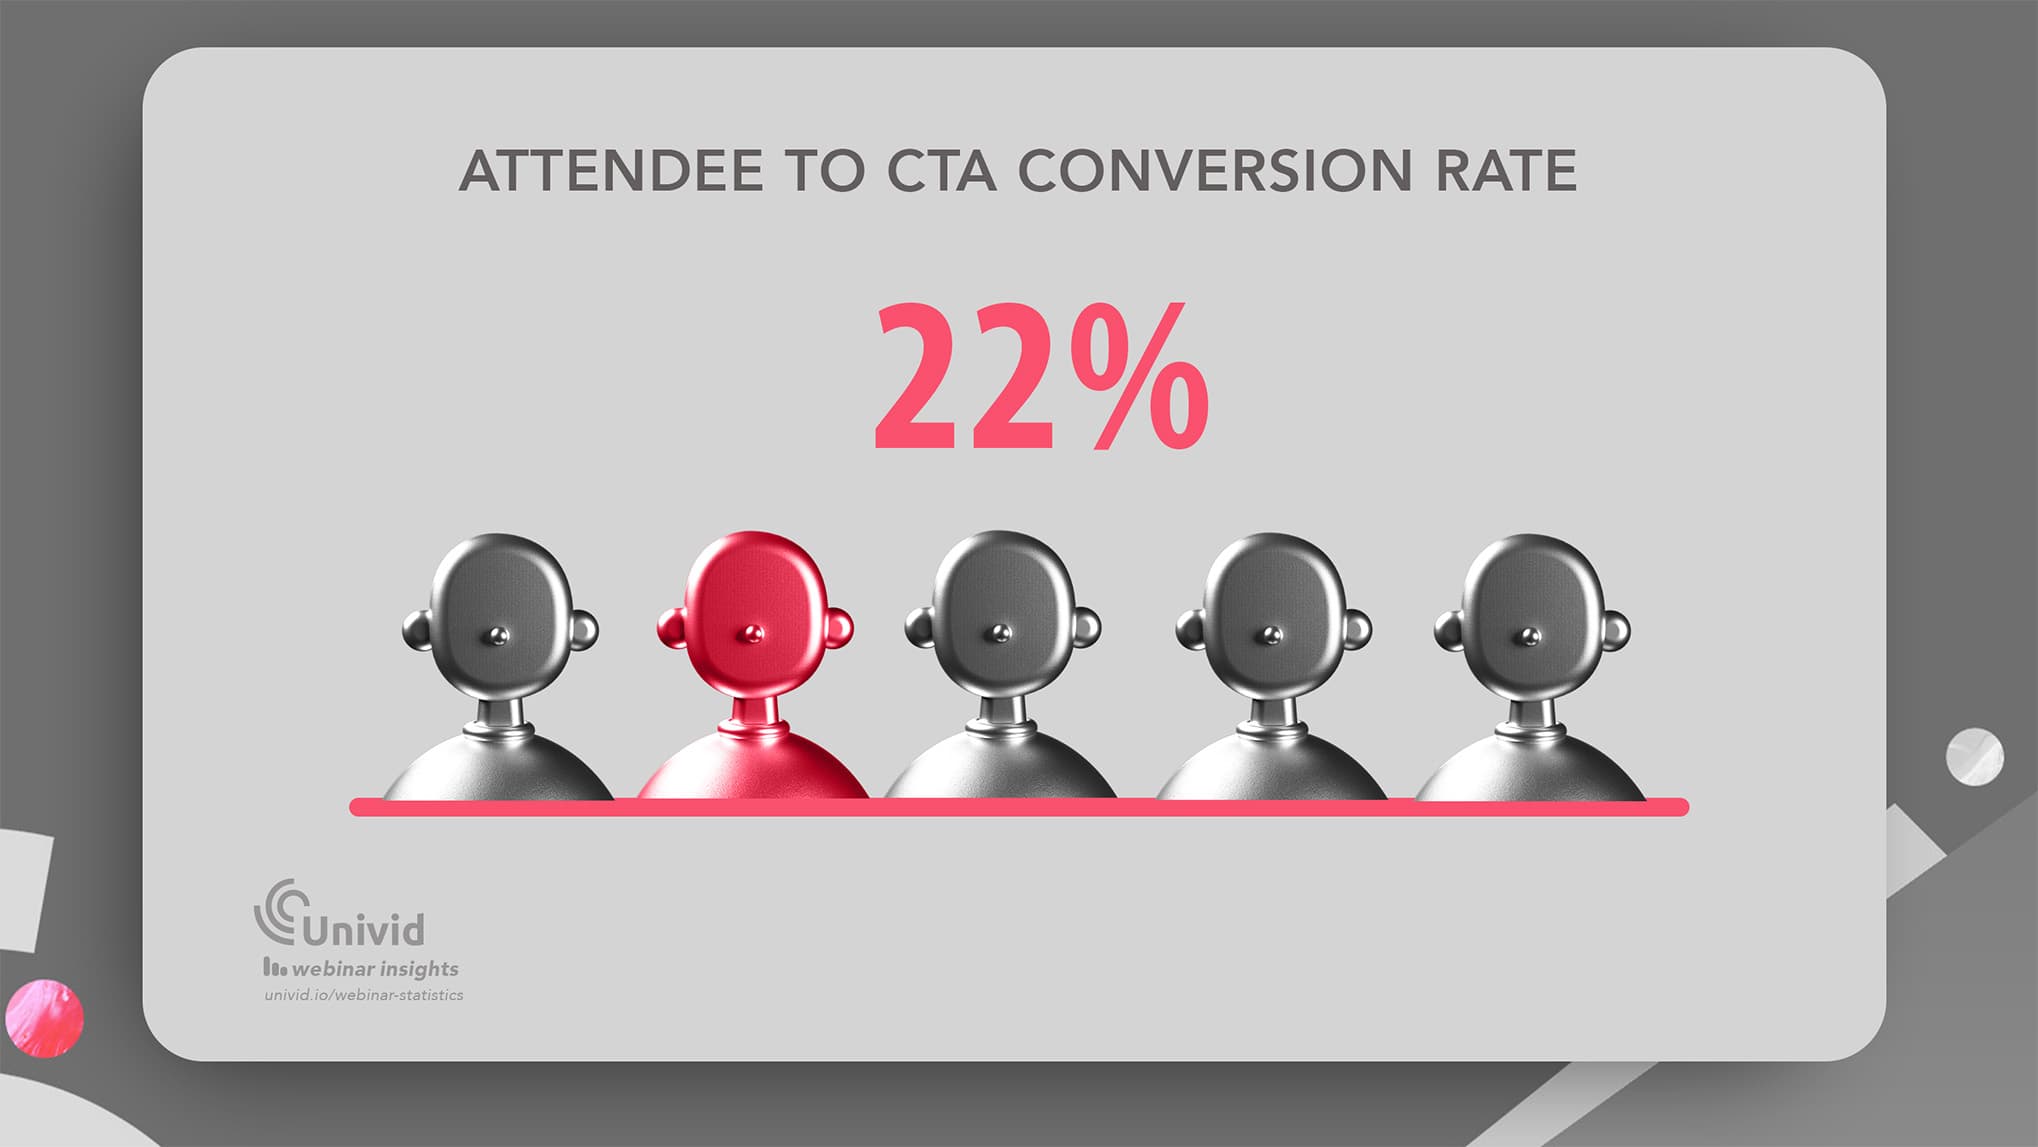
Keep in mind the nature of CTA and the size of the ask - heavily influences what conversion rate to expect. Meaning if you push for "Book a demo" vs. "Download today's slides" you will naturally see a difference in conversion.
22. Having 2 CTA:s yields the highest conversion (25%)
(Source: Univid Webinar Insights 2026)
How many CTA:s are optimal?
Well, Univid data shows that having two CTA:s active throughout the webinar seems to yield the highest amount of clicked CTA:s relative to attendees - with a 25% CTA conversion rate. Possibly as it gives optionality to convert in a way that suits the attendee, while not making it complex with too many options.
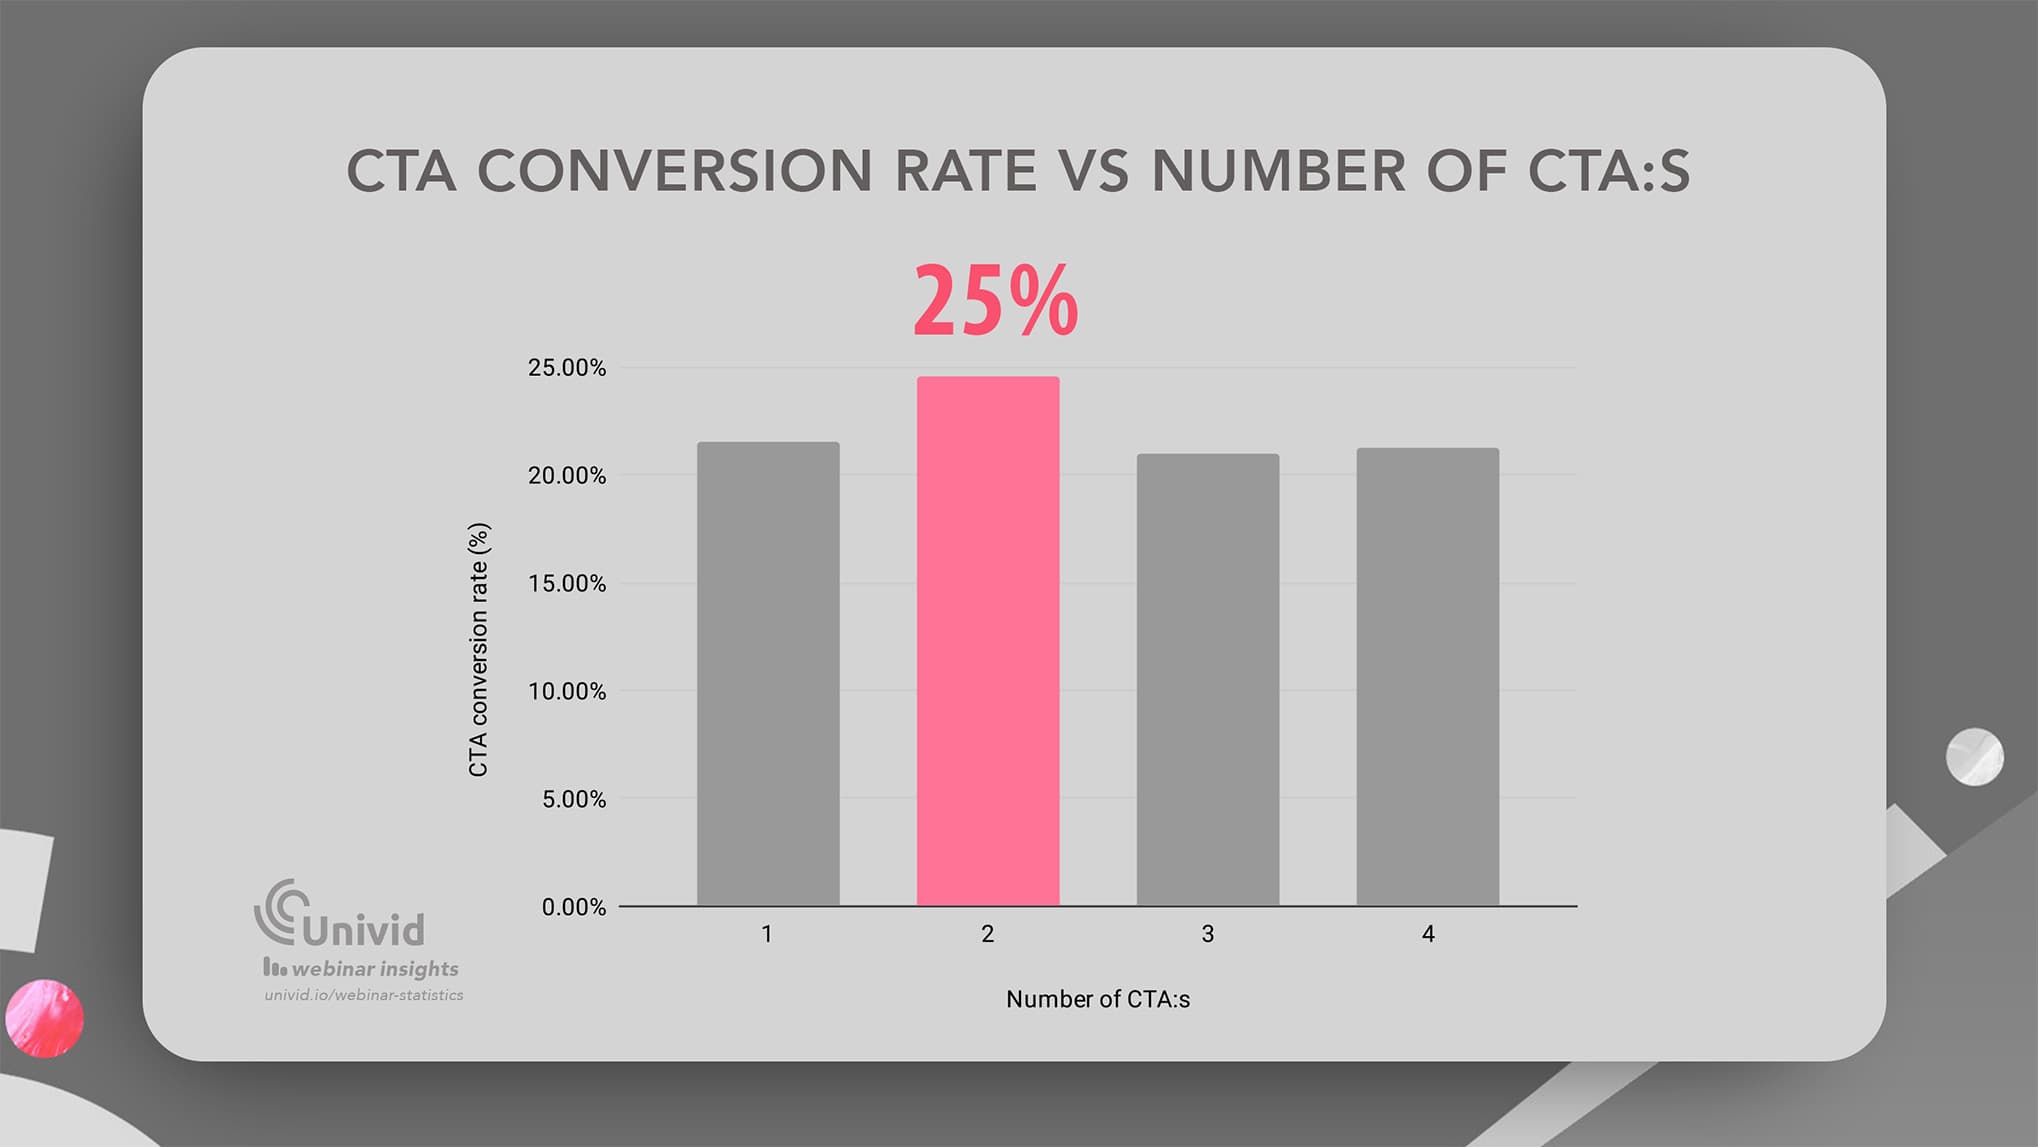
The second best option: keep it simple and only have 1 active CTA - resulting in a 22% CTA conversion rate.
Learn how Andreas and B2B SaaS company Inyett run their webinars with CTA:s on Univid to get 1000s of signups.

23. CTA conversion rates are highest in the afternoon (29%)
(Source: Univid Webinar Insights 2026)
Comparing conversion rates across the day, data shows that CTA:s convert better in the afternoon - with an average conversion rate of 29%.
Time of webinar | CTA conversion rate |
|---|---|
Morning (8AM - 11:59AM) | 22% |
Lunch (12AM - 12:59PM) | 13% |
Afternoon (1PM - 5PM) | 29% |
Conversion rates on CTA button vs. time of day the webinar is hosted.
Hosting webinars during lunch hours result in the lowest conversion rates (13%). Likely as attendees are busy doing other things (like eating or preparing lunch) at the same time as attending the webinar. But as we see in upcoming statistics - 12AM is quite decent in terms of attendance rate.
24. Smaller webinars show the highest CTA conversion rates (26%)
(Source: Univid Webinar Insights 2026)
Bigger is not always better. At least if we look at CTA conversion rates.
Smaller webinars seem to yield higher CTA conversion rates, with 50-100 attendee webinars resulting in the highest CTA conversion rate of 26%.
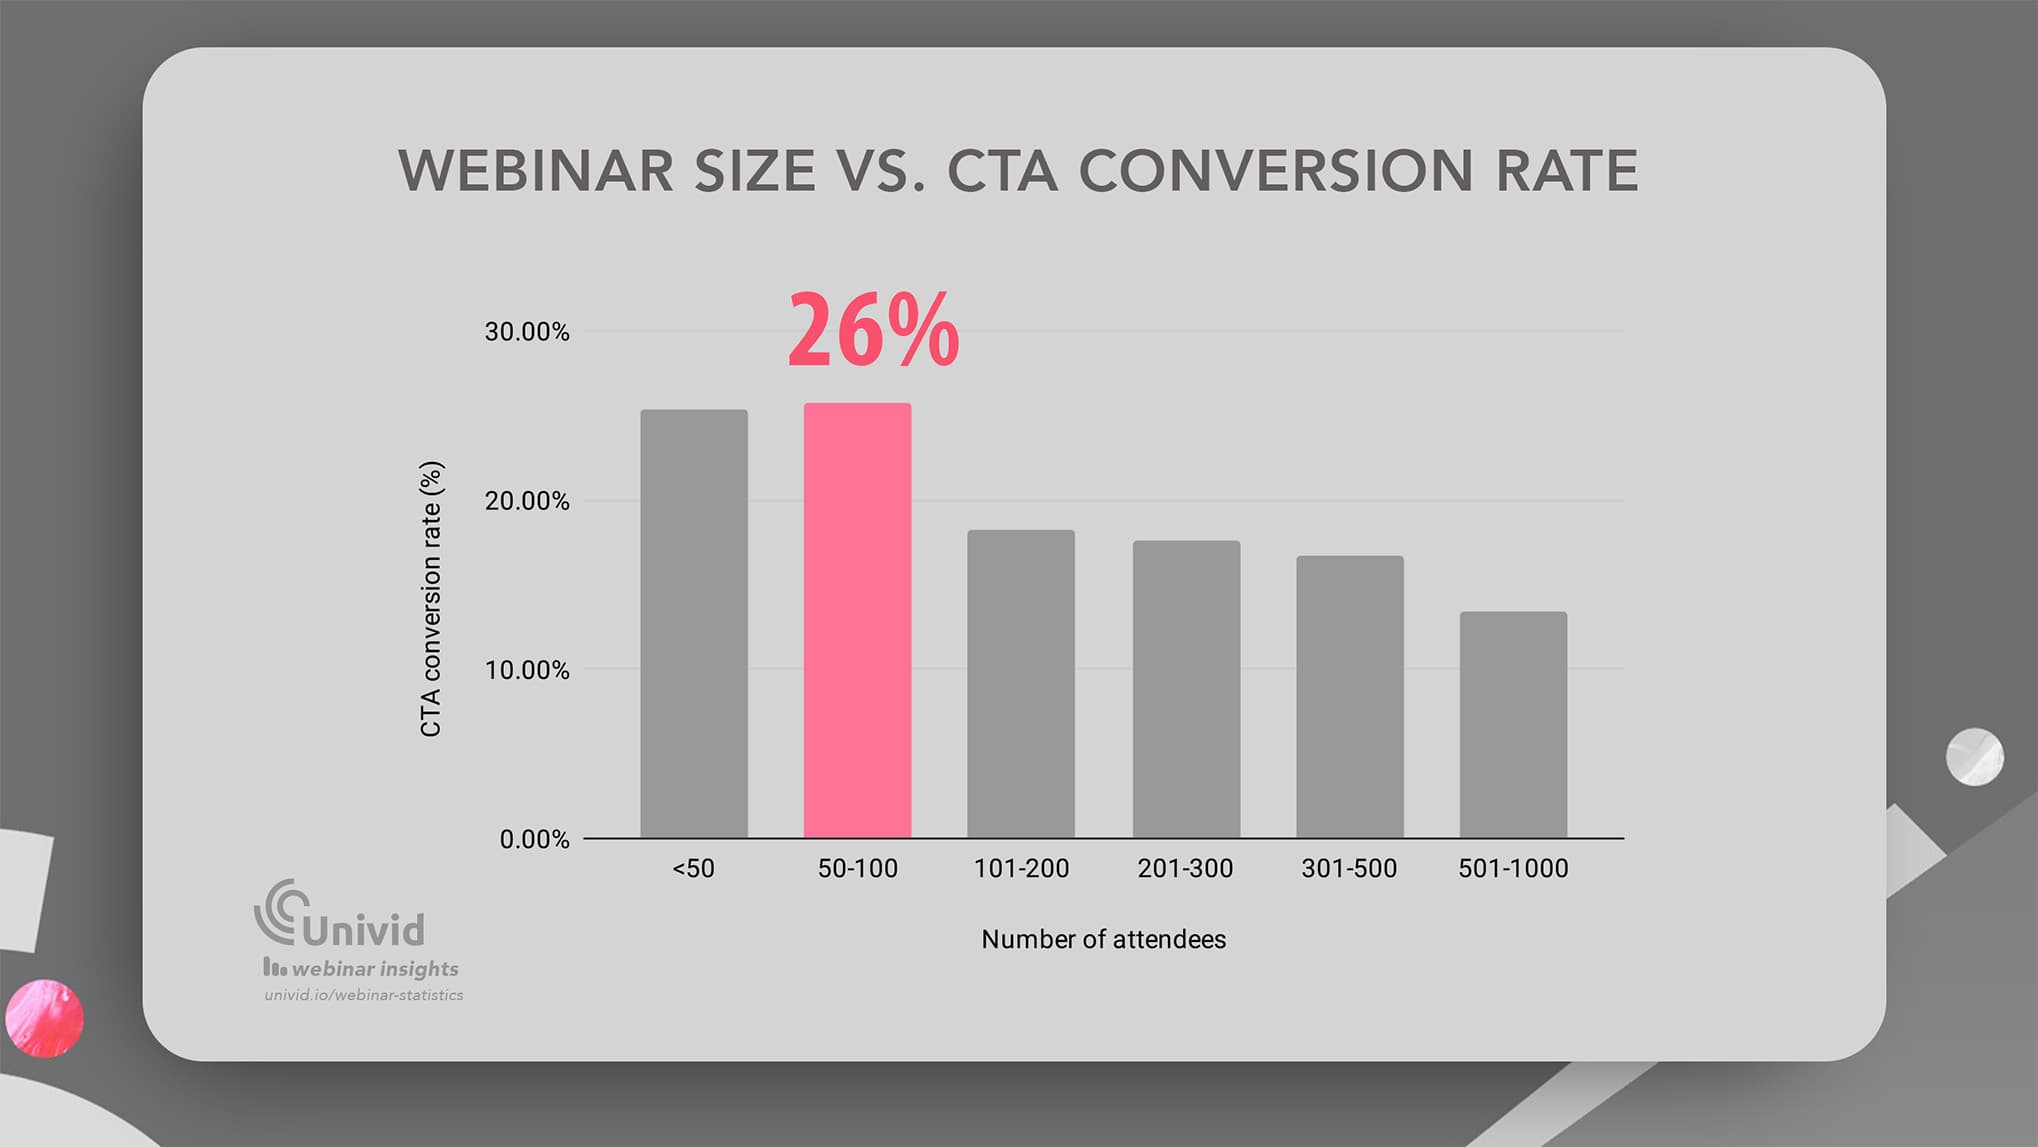
This, likely means targeting of signups naturally tend to become broader as the webinar audience size grow. So, don't underestimate the power of small niche webinars.
25. Still, bigger webinars result in more CTA clicks
(Source: Univid Webinar Insights 2026)
However, if we look at absolute number of conversions. Not surprisingly, bigger webinars result in more CTA clicks. Webinars between 501 - 1000 attendees get an average of 82 CTA conversions per webinar (as measured by clicks on a CTA button).
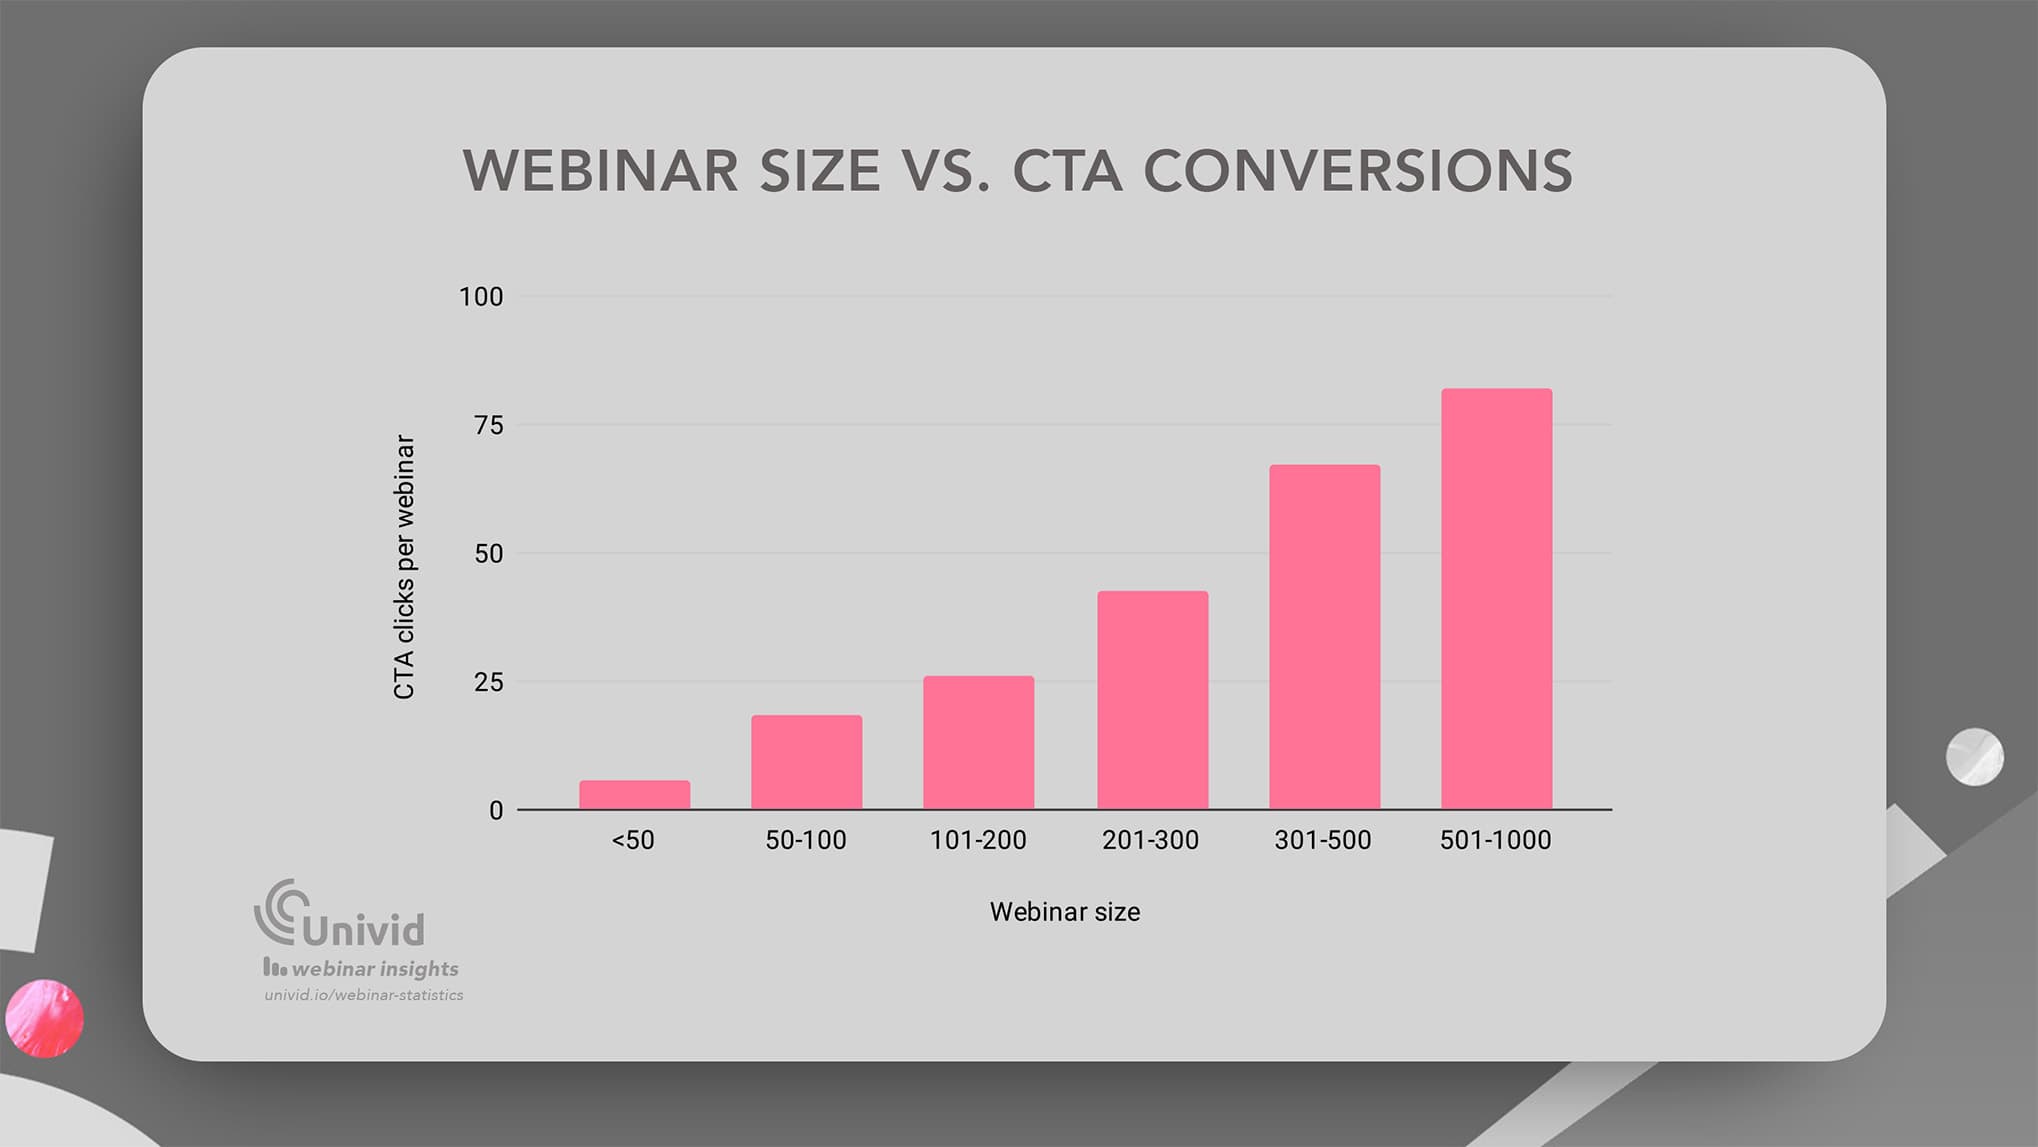
So depending on what your cost is to generate each signup, it is likely worth getting that big audience number in.
Especially, if you look at awareness as metric too, and not just blindly at CTA conversion rate.
Webinar formats & duration statistics
26. The average webinar is 60 minutes long
(Source: Univid Webinar Insights 2026)
Looking at the average duration of webinars - the average webinars is 60 minutes long.

While there are both longer and shorter webinars out there, many webinars have a duration around the 60 minute mark. In the next statistic, we will look into more details around the popularity of different webinar durations.
27. The most popular length of webinars is 60 minutes (37%)
(Source: Univid Webinar Insights 2026)
Data shows that most webinars hosted are between 30 and 60 minutes in length. Where the most popular webinar length is 60 minutes (37% of webinars).
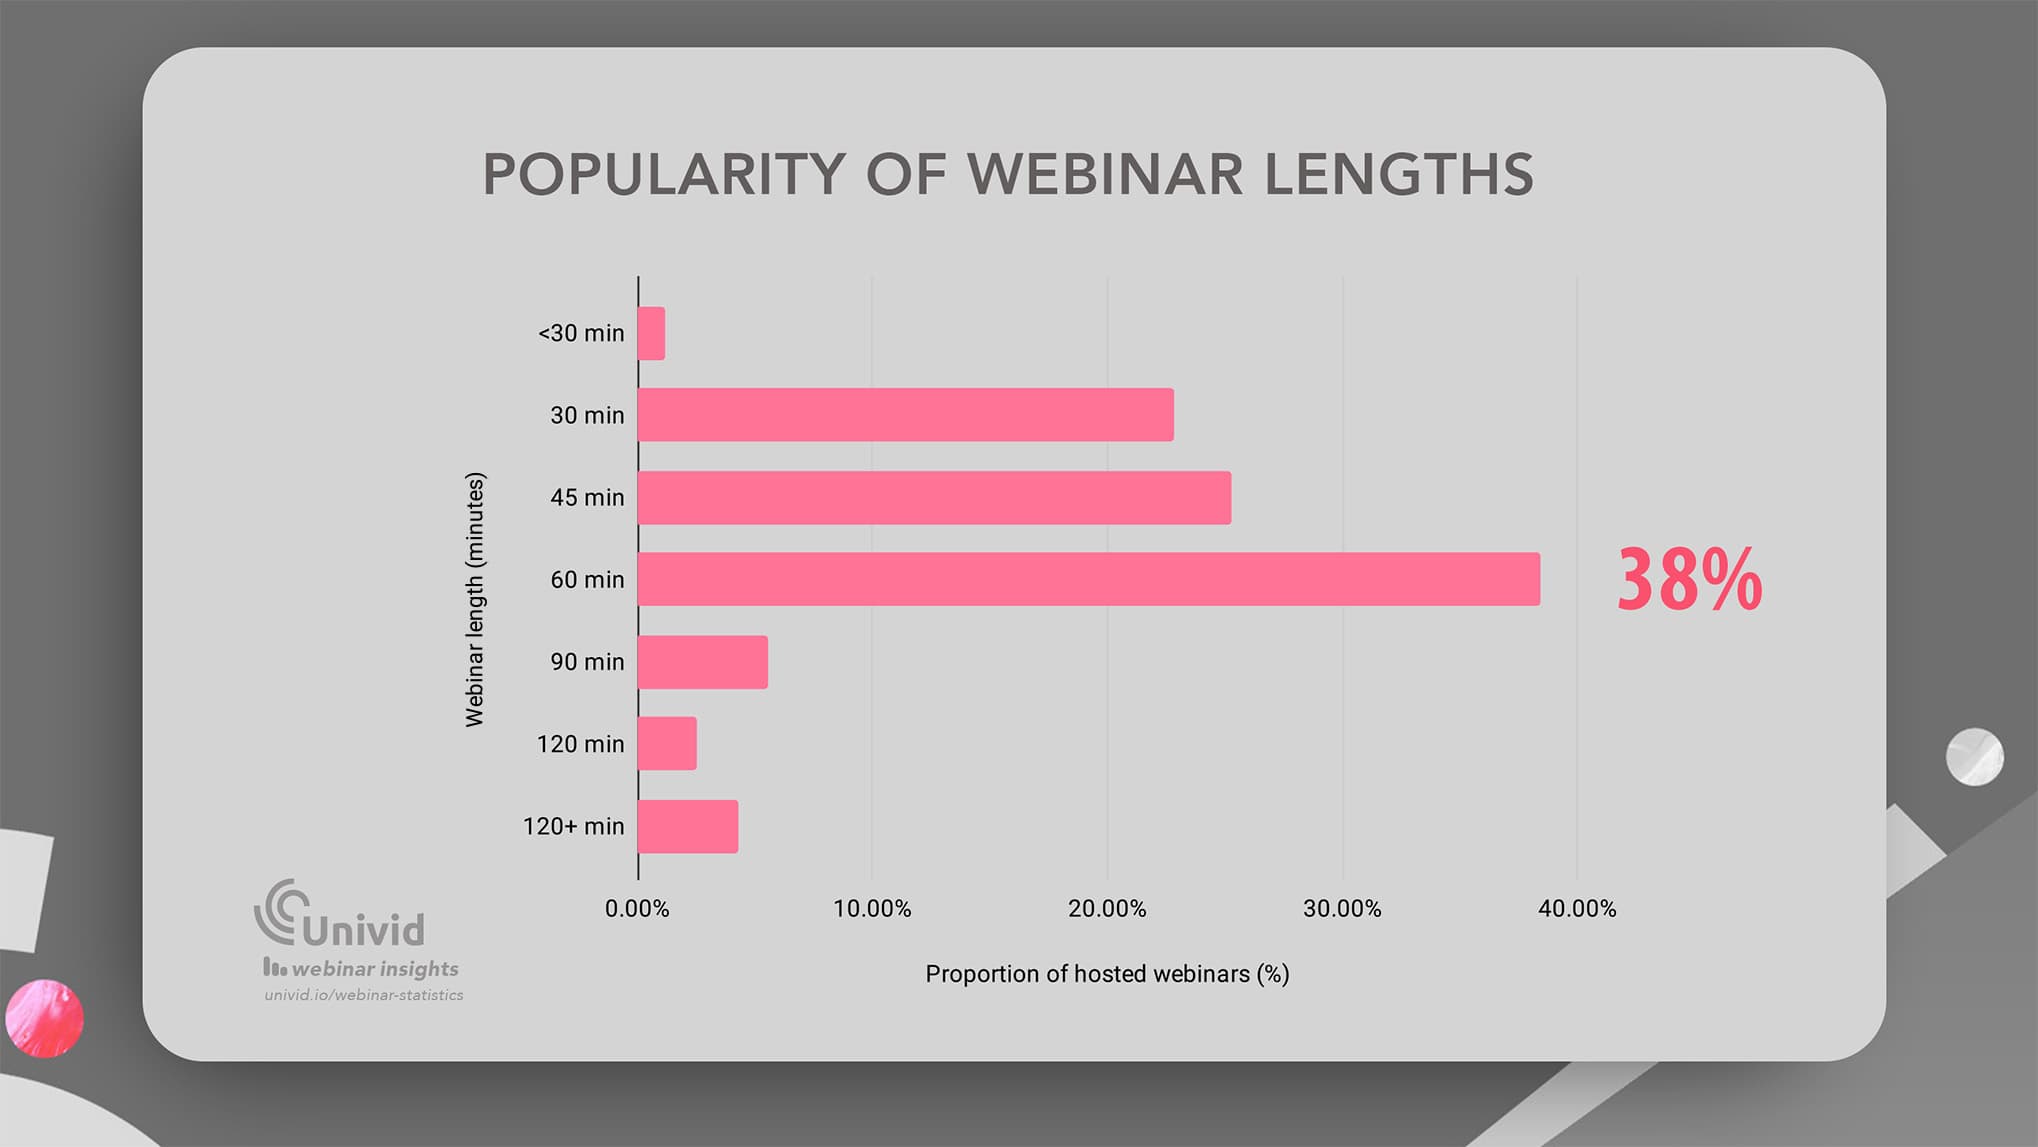
Also, 30 and 45 minute long webinars are common. Together, webinars between 30 - 60 minutes long are the most popular - making up 86% of total webinars.
For more details, the popularity of different webinar lengths are:
Webinar length | Popularity |
|---|---|
< 30 minutes | 1% |
30 minutes | 27% |
45 minutes | 24% |
60 minutes | 37% |
90 minutes | 5% |
120 minutes | 2% |
> 120 minutes | 4% |
Table with popularity of different webinar lengths
28. 60 minute long webinars have the highest attendance rate (62%)
(Source: Univid Webinar Insights 2026)
Looking at total attendance rate (including live and on-demand views) 60 minute long webinars yield the highest attendance rate of 62%.
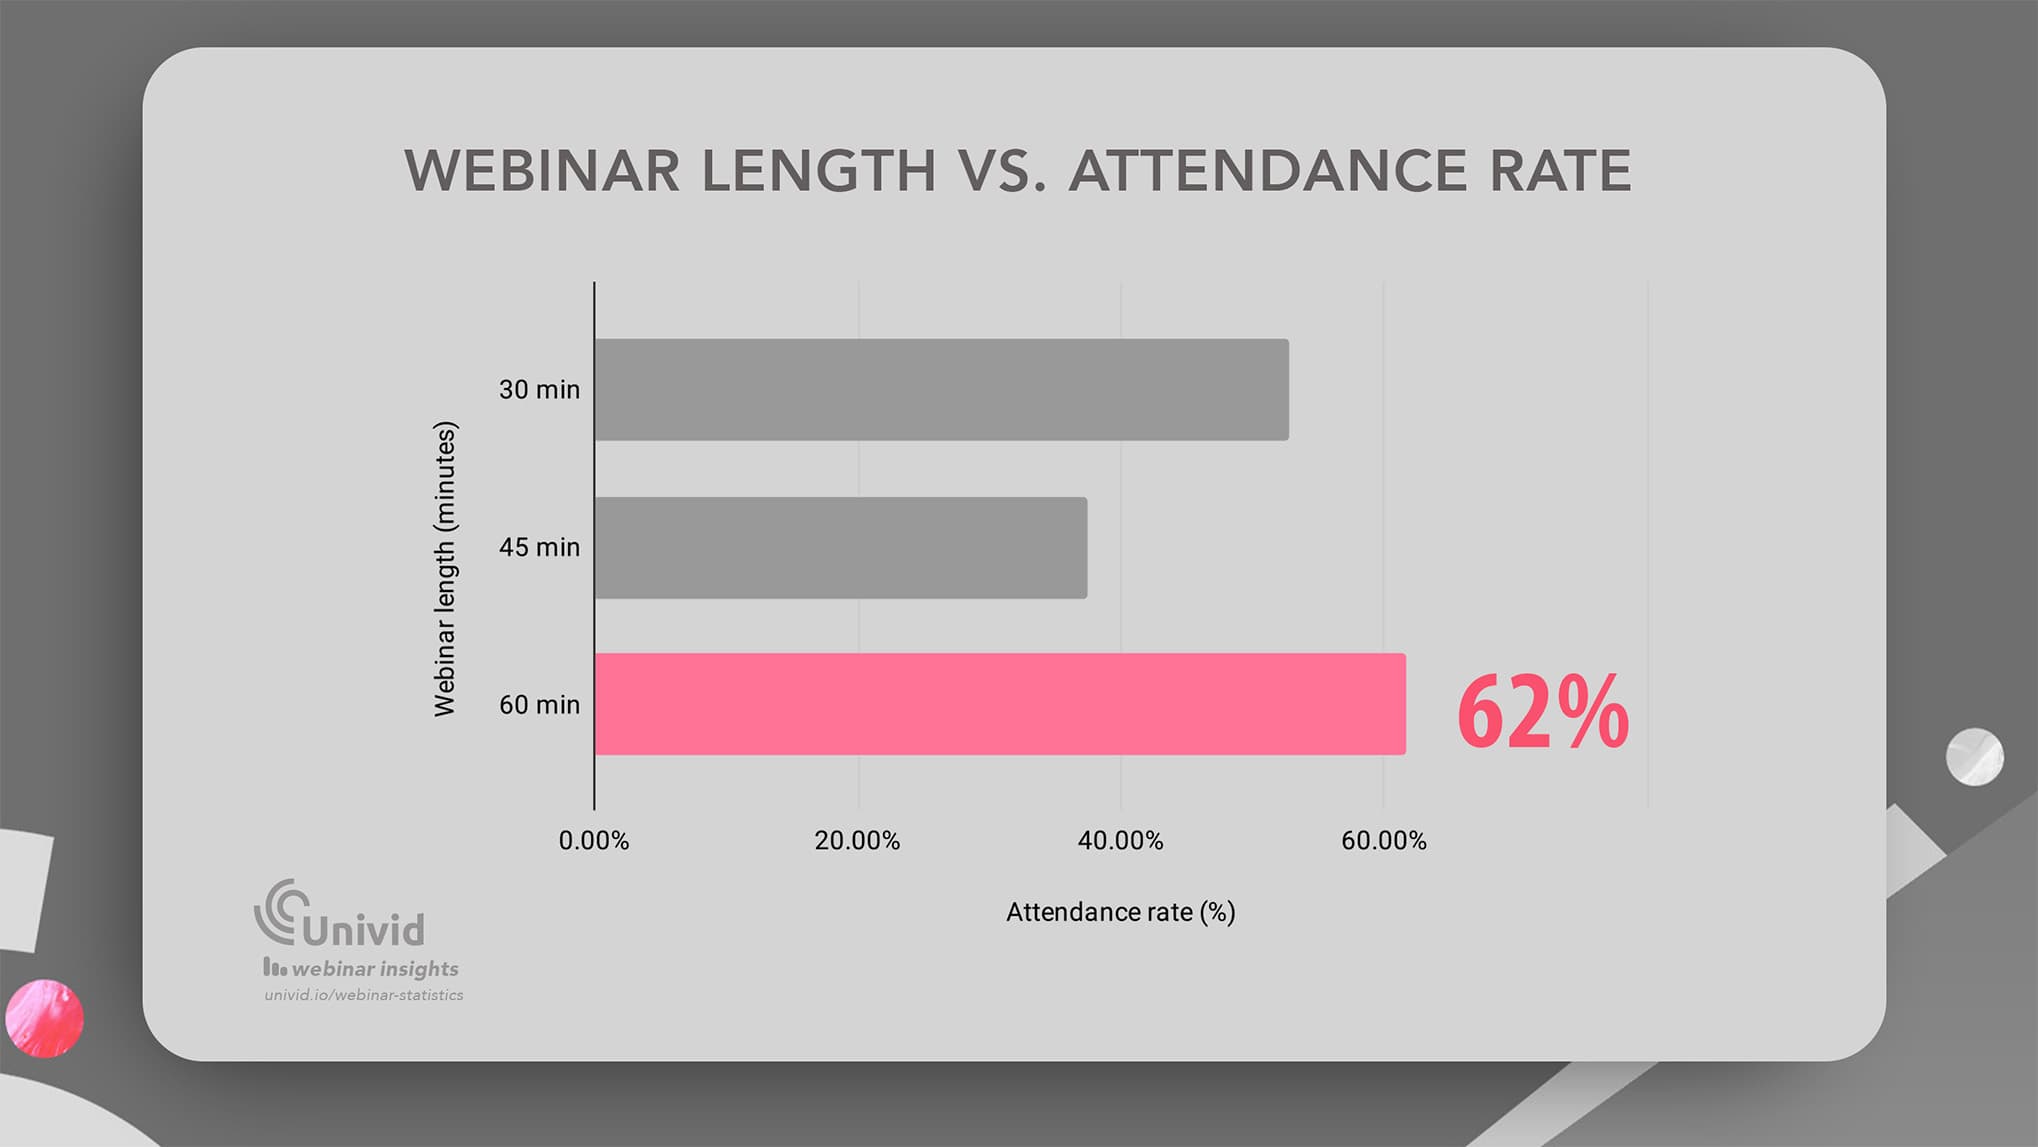
This could indicate that people feel there will be more in-depth value in a 60 minute long webinar, so it must be worth attending - either when considering attending live or watching the replay.
However, data shows, shorter webinars of 30 minutes - seem to have a higher percentage watch time, when comparing against longer ones of 45 - 90 minutes. Meaning just because more people might show up, it does not mean they will stay the entire time.
With longer webinars you need to involve more activating engagement to make the attendees keep focus and stay. For example, working with Q&A throughout, or activating via polls.
29. 60 minute long webinars convert the highest (26%)
If you optimize for conversion from attendee to CTA clicked - webinars that are 60 minutes long seem to convert the highest (26% CTA conversion rate).
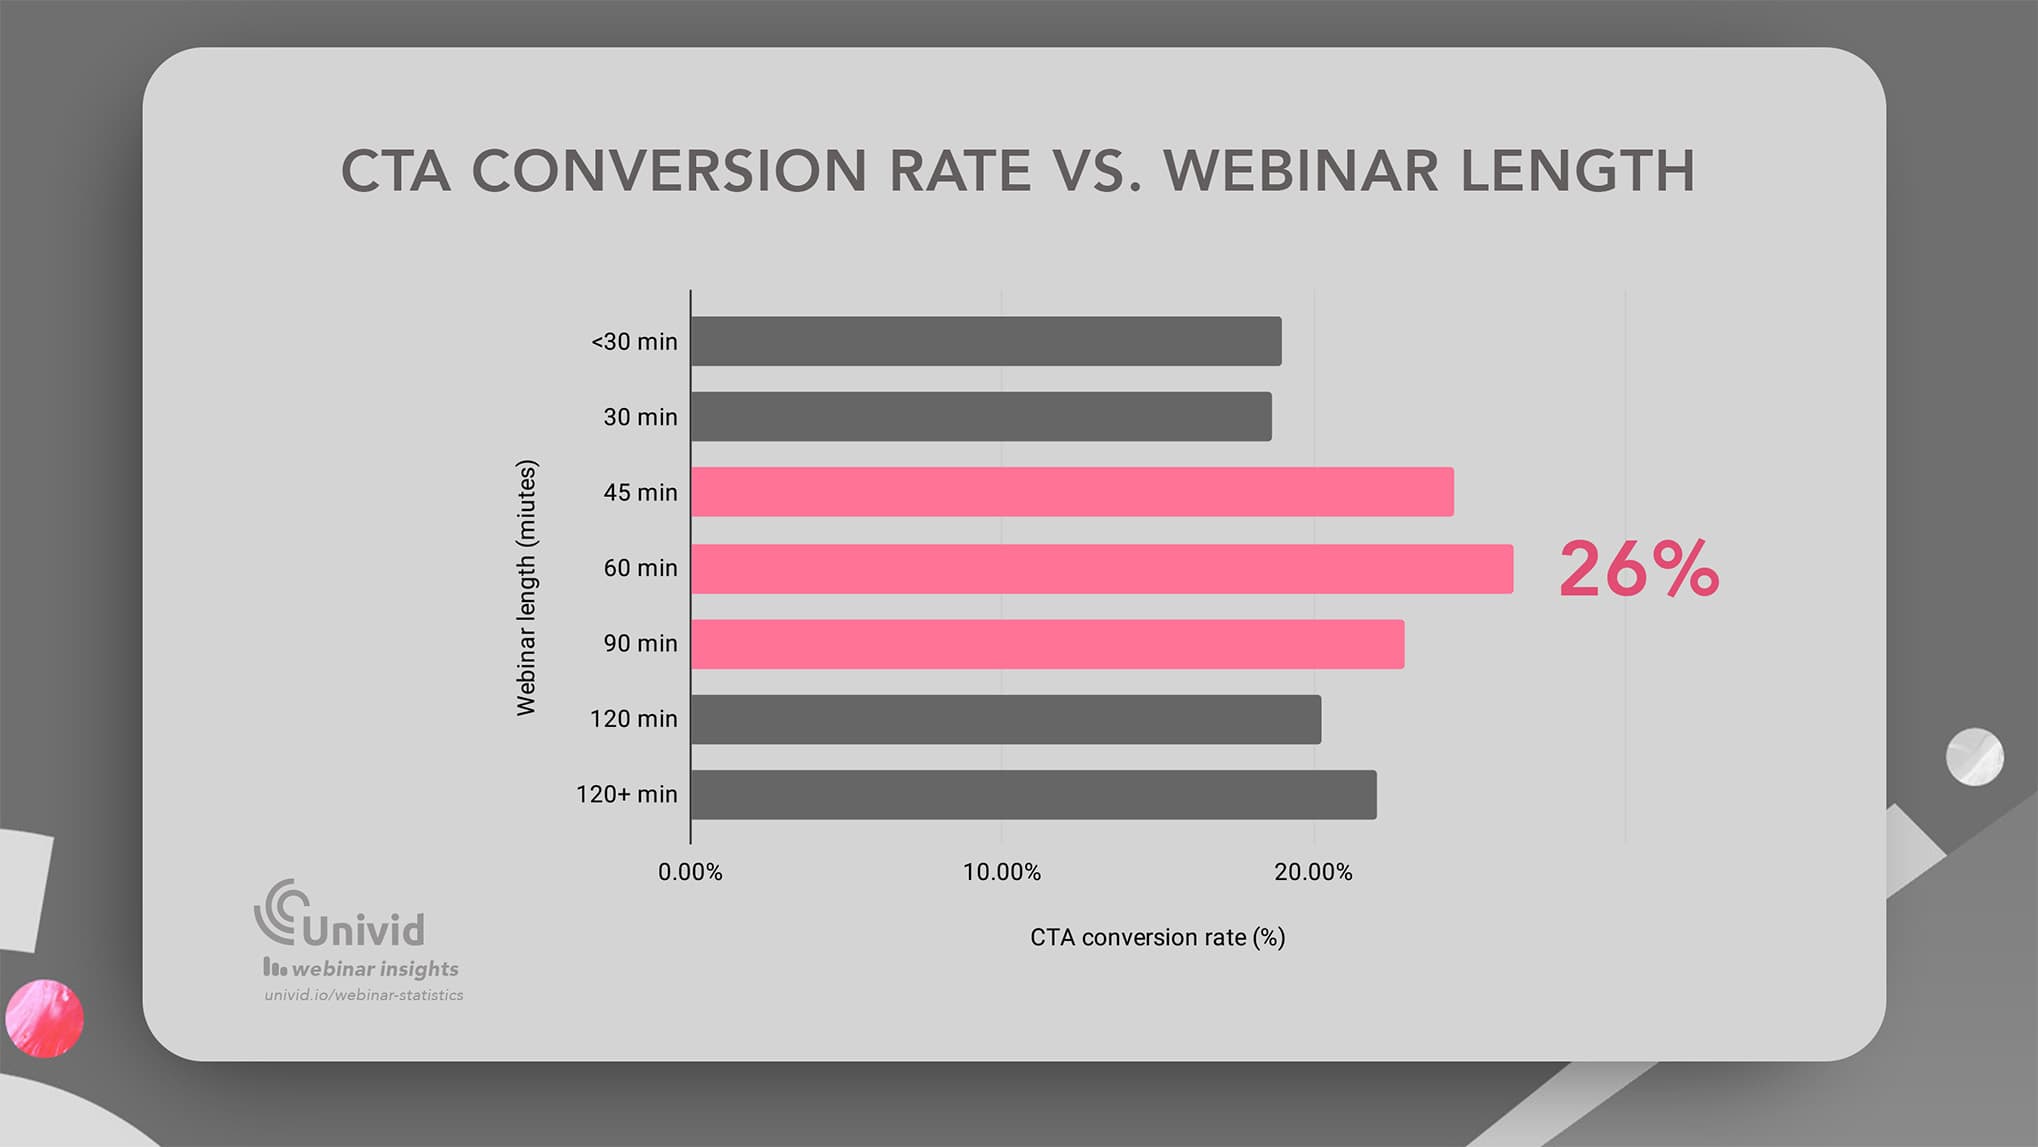
The second best option is to host 45 minute long webinars - that result in an average 25% CTA conversion rate.
Webinar timing & scheduling statistics
Scheduling your webinar means choosing the right date, day of the week, and time of the day to maximize the amount of registrations to your webinar, and the attendance rate.
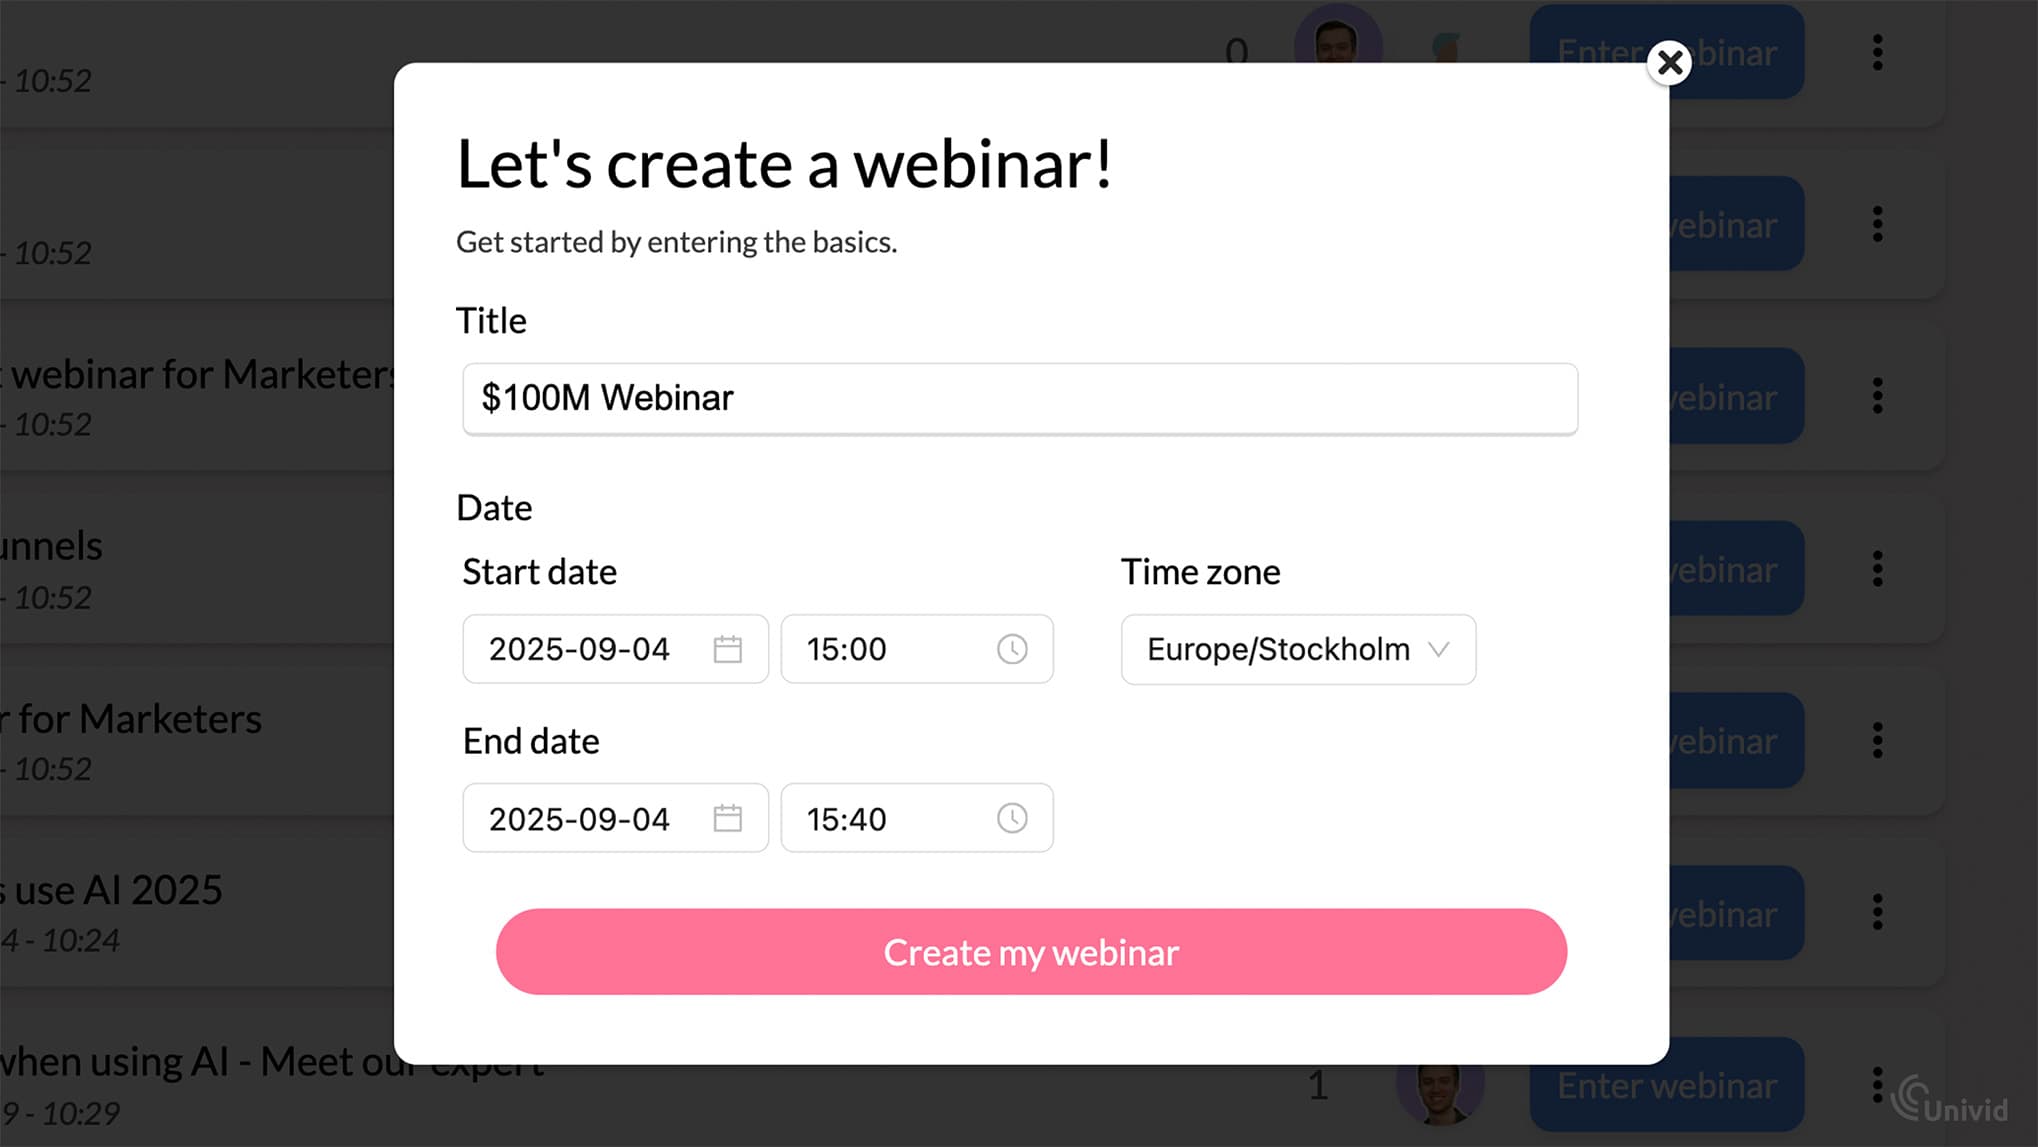
Here are a few webinar statistics around timing and scheduling - to help you benchmark and choose right.
30. Most webinars are hosted in fall and spring (86%)
(Source: Univid Webinar Insights 2026)
Webinars are hosted more towards fall months and spring months - with around 43% of webinars hosted in Spring (March - May), and 43% of webinars hosted in Fall (September - November).
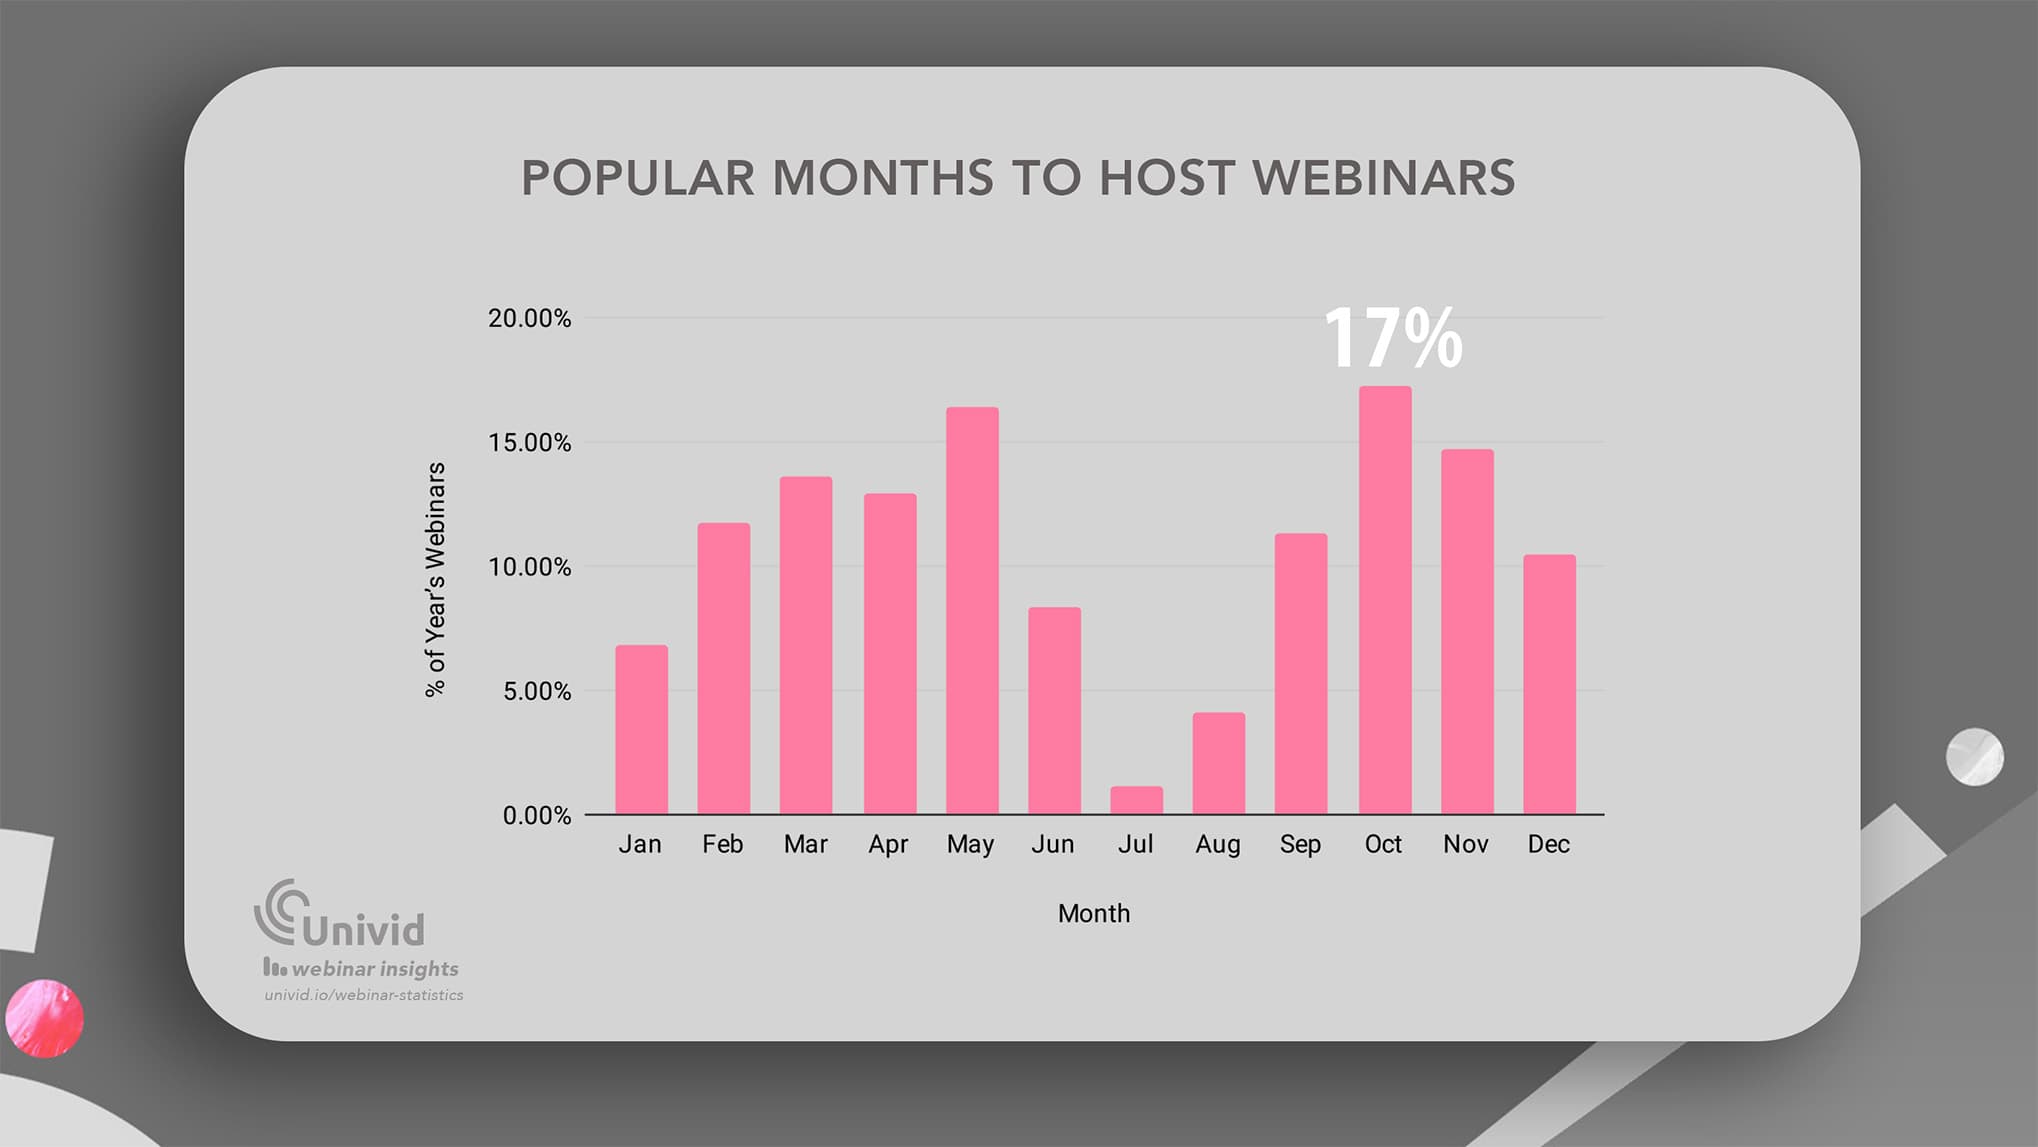
Only 5% of webinars are hosted during Summer months (July - August). But remember:
As we see in data when looking at attendance rates - popular also means a lot of competition for the audience's attention. More on this in the next webinar statistic.
Organizations that host webinars consistently, meaning at least 1 time month, have higher attendance rate compared to those who don't.
And your specific audience and market highly influence when it makes sense for you to host.
Tip: To nail high attendance, consider hosting in months like September, that captures ~11% of annual webinars - where competition is lower than the peaks of fall and spring, but far busier than the summer months.
31. January is the month with the highest attendance rates (51%)
(Source: Univid Webinar Insights 2026)
Interestingly, looking at attendance rate, we see that January has the highest attendance rate of 51%. But it's far from the most popular month to host webinars, as we saw in the previous statistic. Followed by May (46.3%), and October (44.8%) that also show strong average attendance rates.
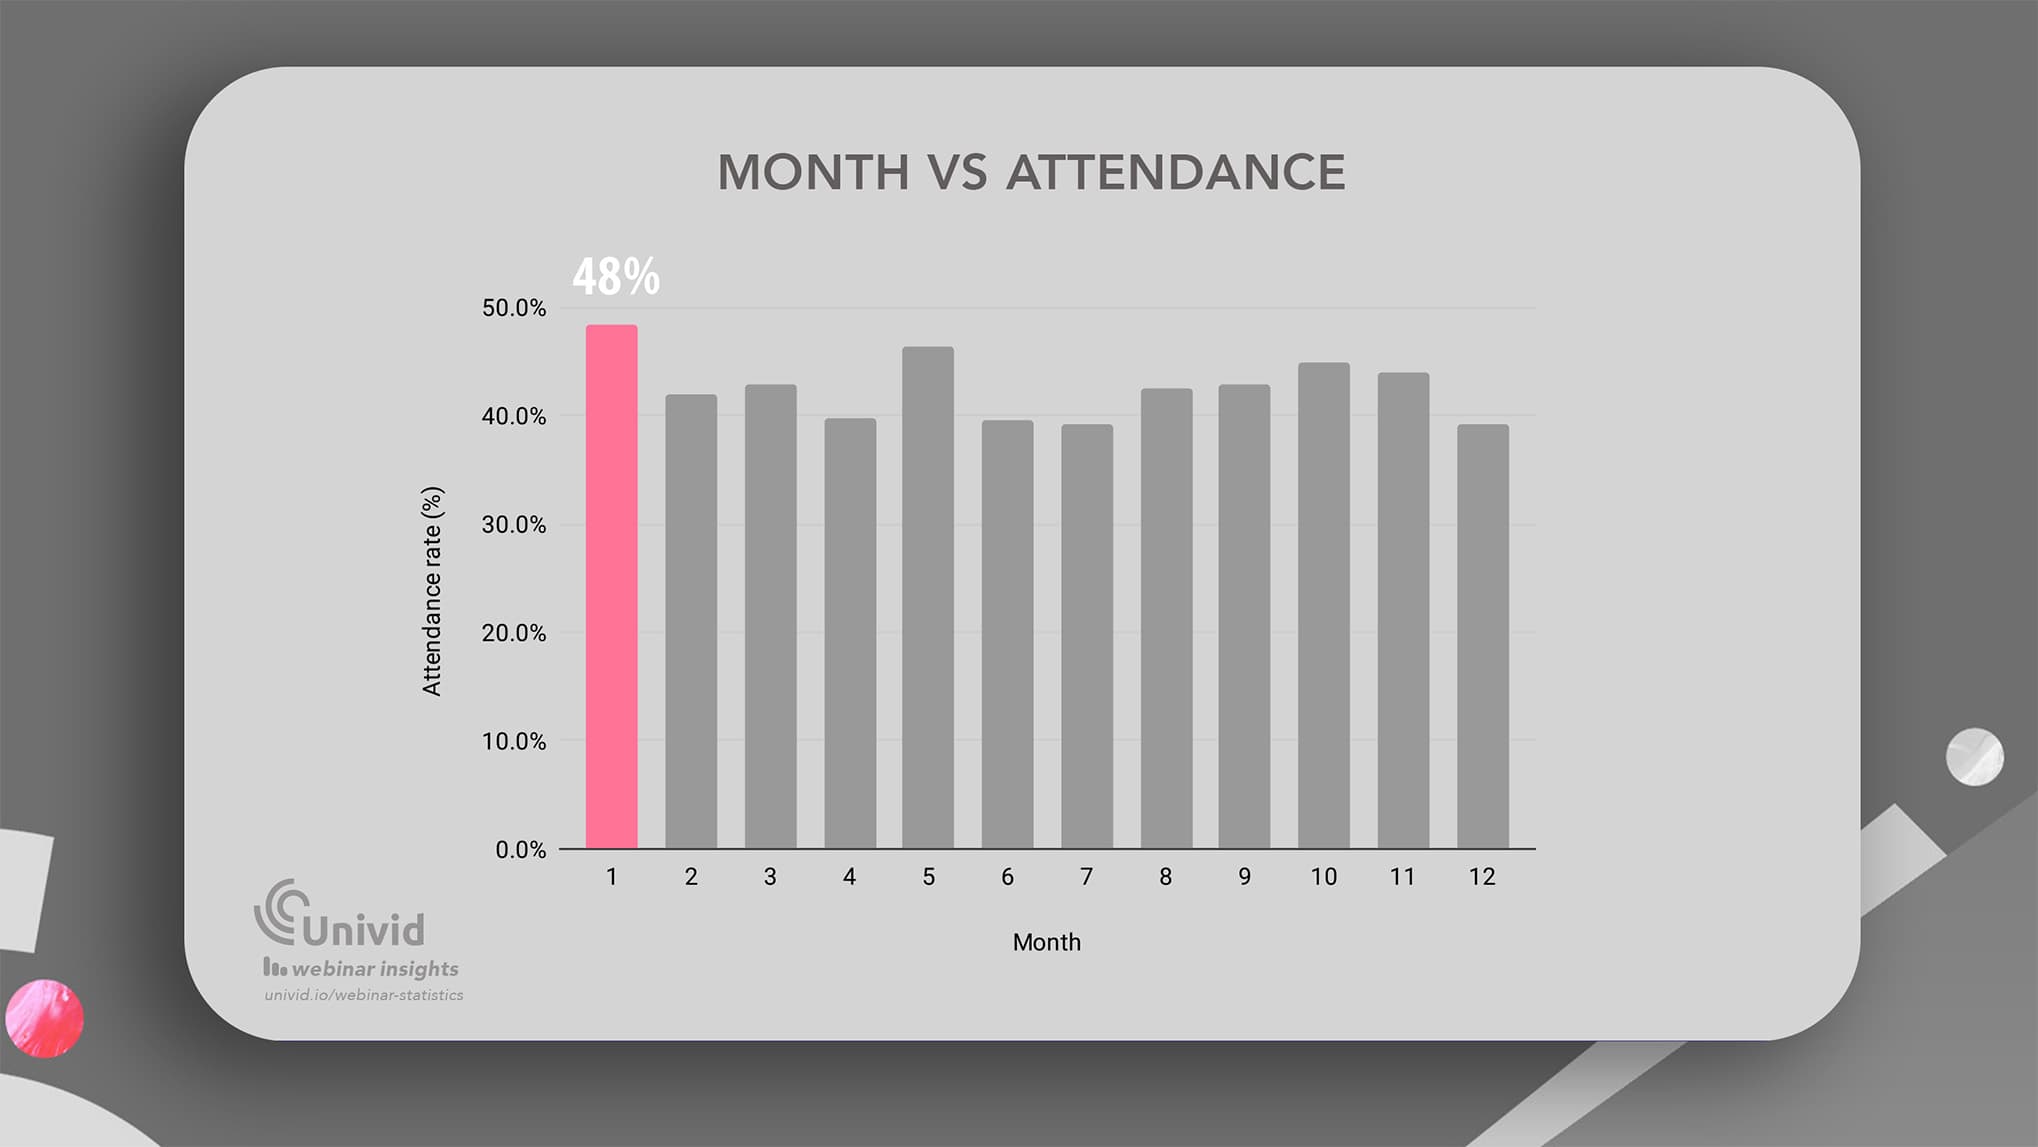
This confirms the thesis that in popular months of hosting webinars, you also compete harder for the audience's attention. Thus, choosing some of the less intense months might actually benefit the attendance of your webinars.
32. Tuesdays and Thursdays are most popular to host (30% and 28%)
(Source: Univid Webinar Insights 2026)
Univid data shows there are two weekdays that clearly are the most popular when it comes to hosting webinars - Tuesdays (30% of the week's webinars) and Thursdays (28% of the week's webinars).
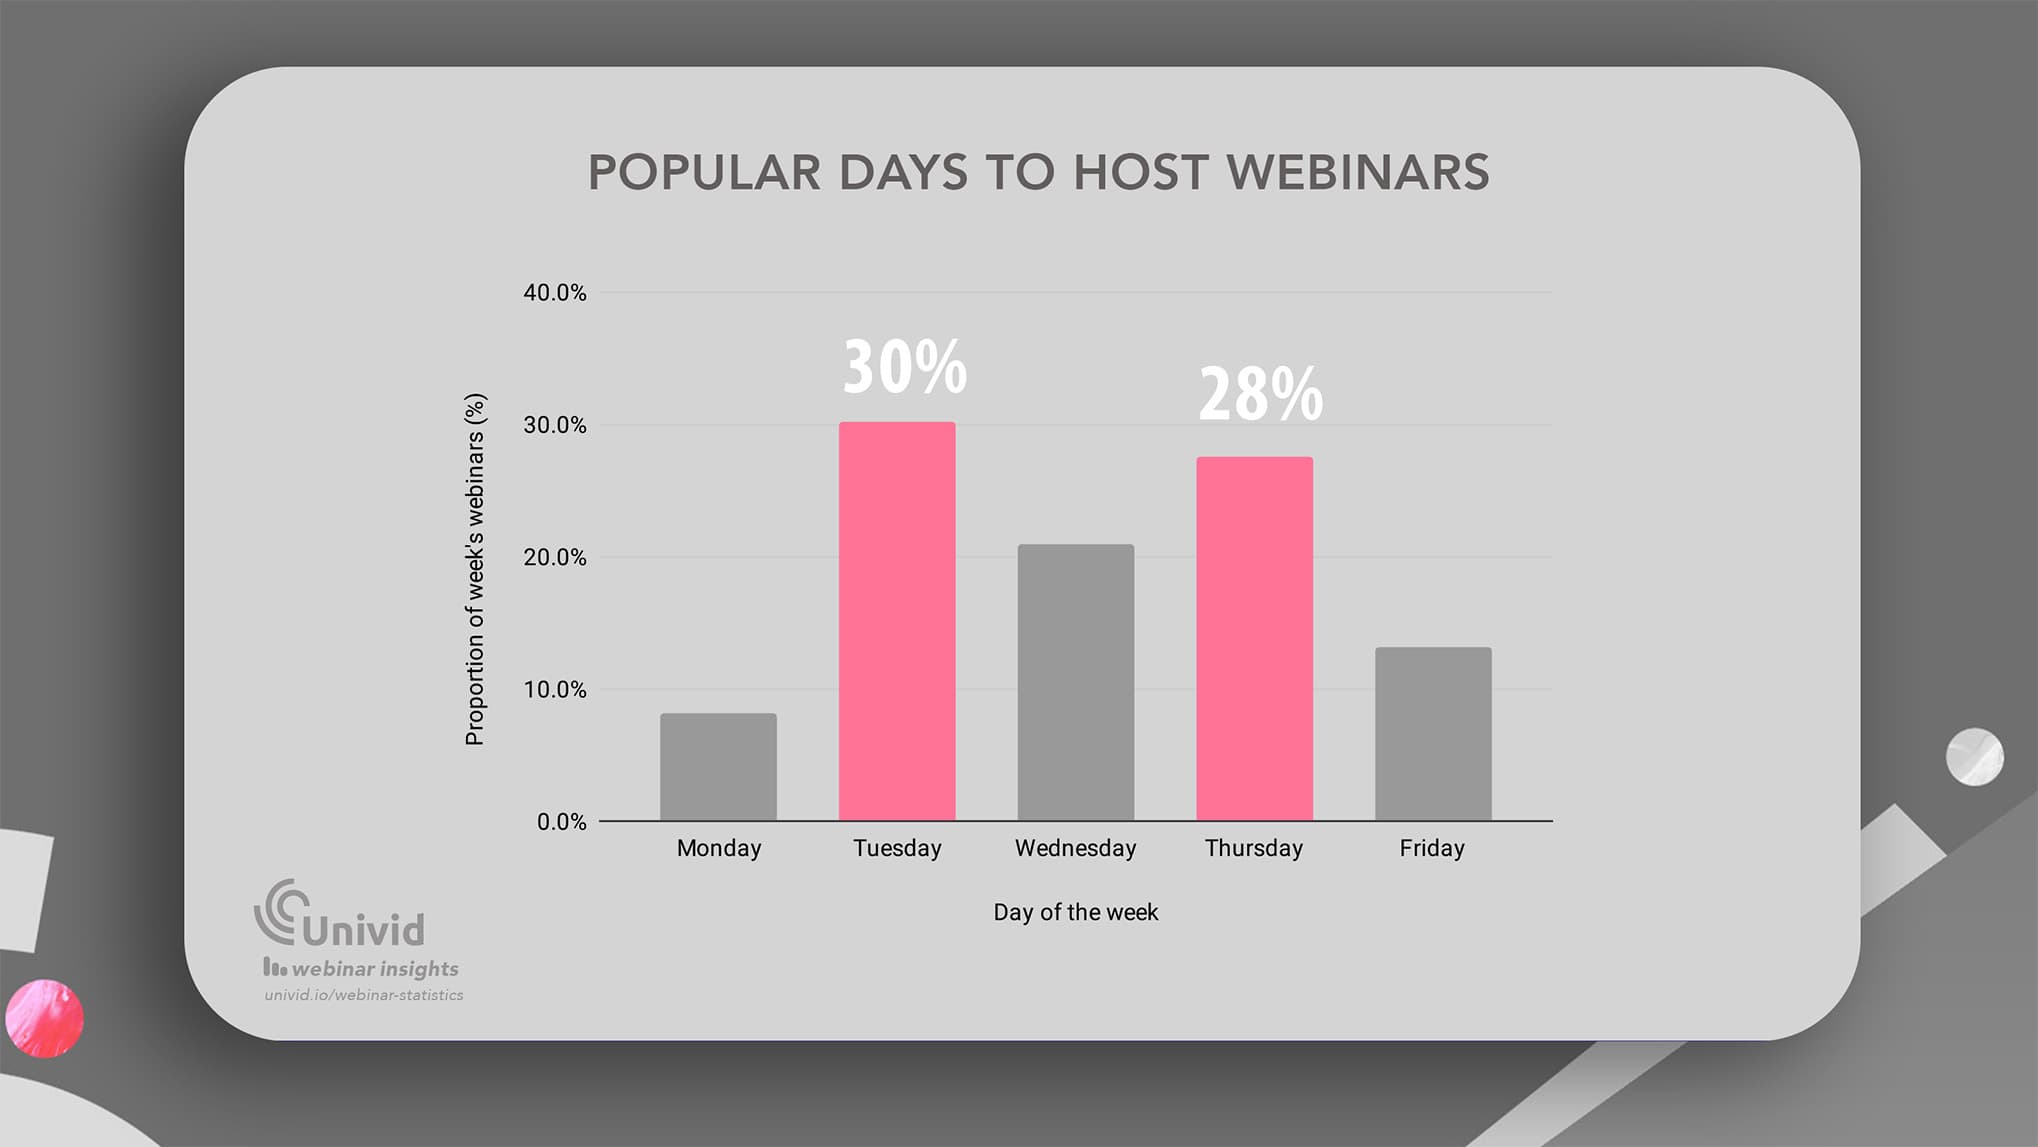
However, that does not mean that they are the best - at least if we look at attendance rates..
33. Wednesdays have the highest live attendance rates (51%)
(Source: Univid Webinar Insights 2026)
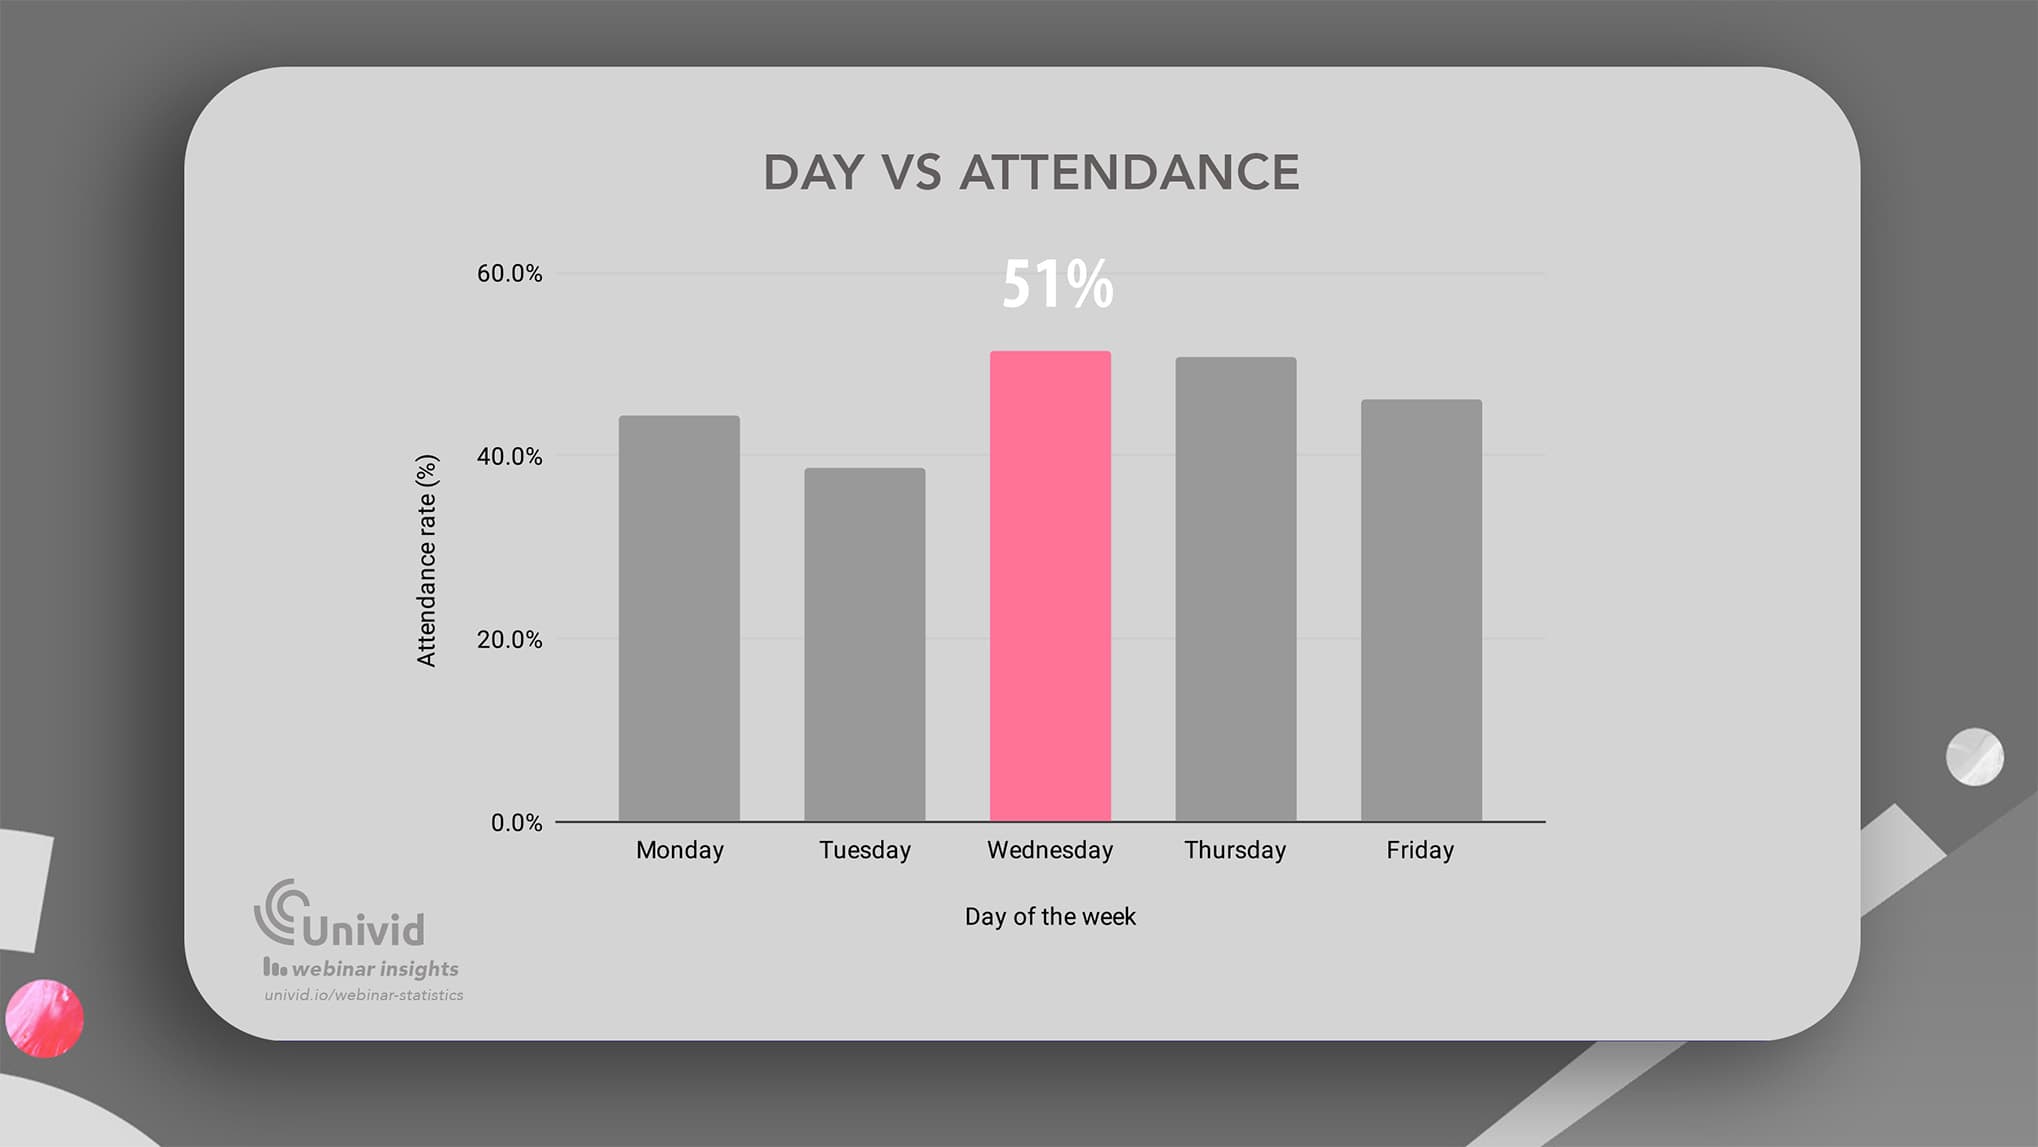
As we saw in the previous statistic, Tuesdays and Thursdays are most popular weekdays to host webinars. Interestingly, data shows that webinars hosted on Wednesdays yield the highest average attendance rates of 51%. Closely followed by Thursdays (50%).
34. Fridays are underrated (only 13% choose them)
(Source: Univid Webinar Insights 2026)
Univid data shows only 13% of webinars are hosted on Fridays, but at the same time Fridays show one of the highest live attendance rates.
💡 Data suggests Fridays are underrated: Despite Fridays being one of the least popular weekdays to host webinars, Fridays show the third highest attendance rate (46%). So - try hosting your next webinar on a Friday, and you might be in for a surprisingly high attendance.
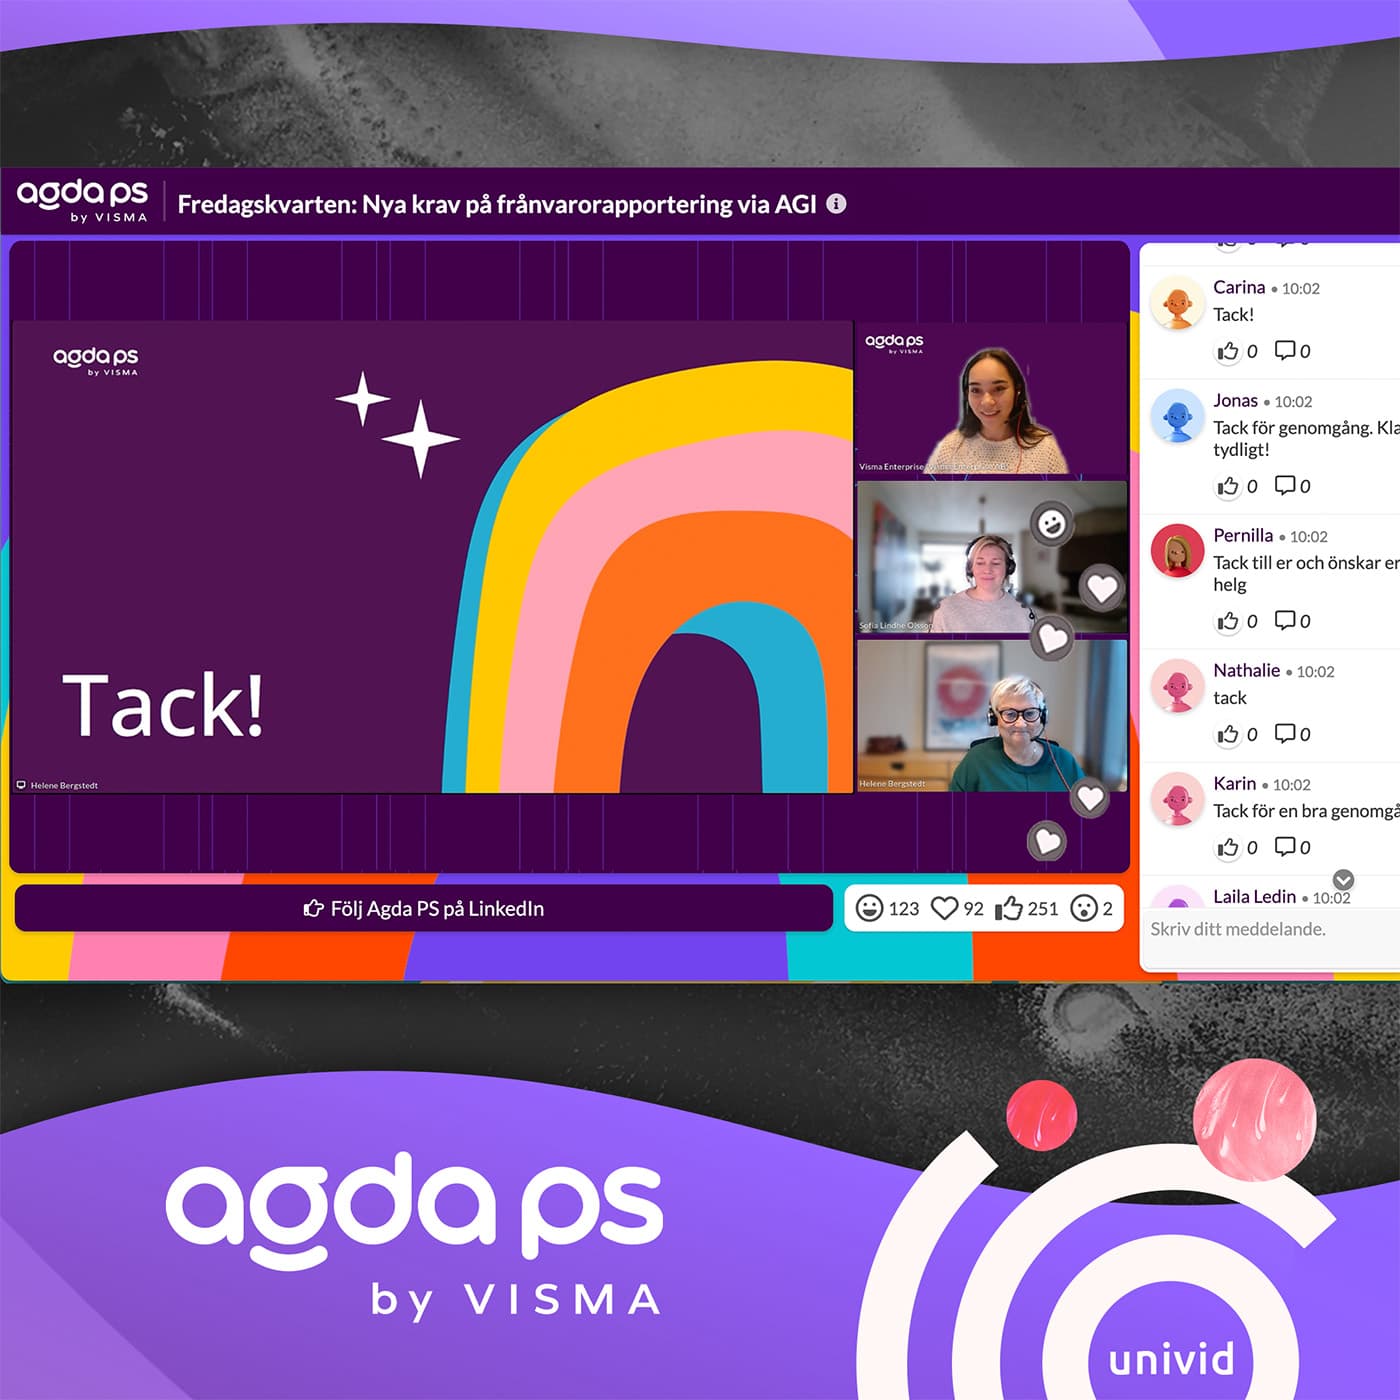
For example, Agda PS has had great success hosting short webinars with lots of engagement on Fridays. Learn more about their Friday webinar strategy here.

35. Webinars at 3PM see the highest live attendance rates (58%)
(Source: Univid Webinar Insights 2026)
When is the best time of day to schedule a webinar?
Our data shows that attendance peaks at 3 PM local time, followed closely by 11 AM, 8 AM, and 6 AM slots. These times align with natural breaks in the workday when professionals are more available to tune in.
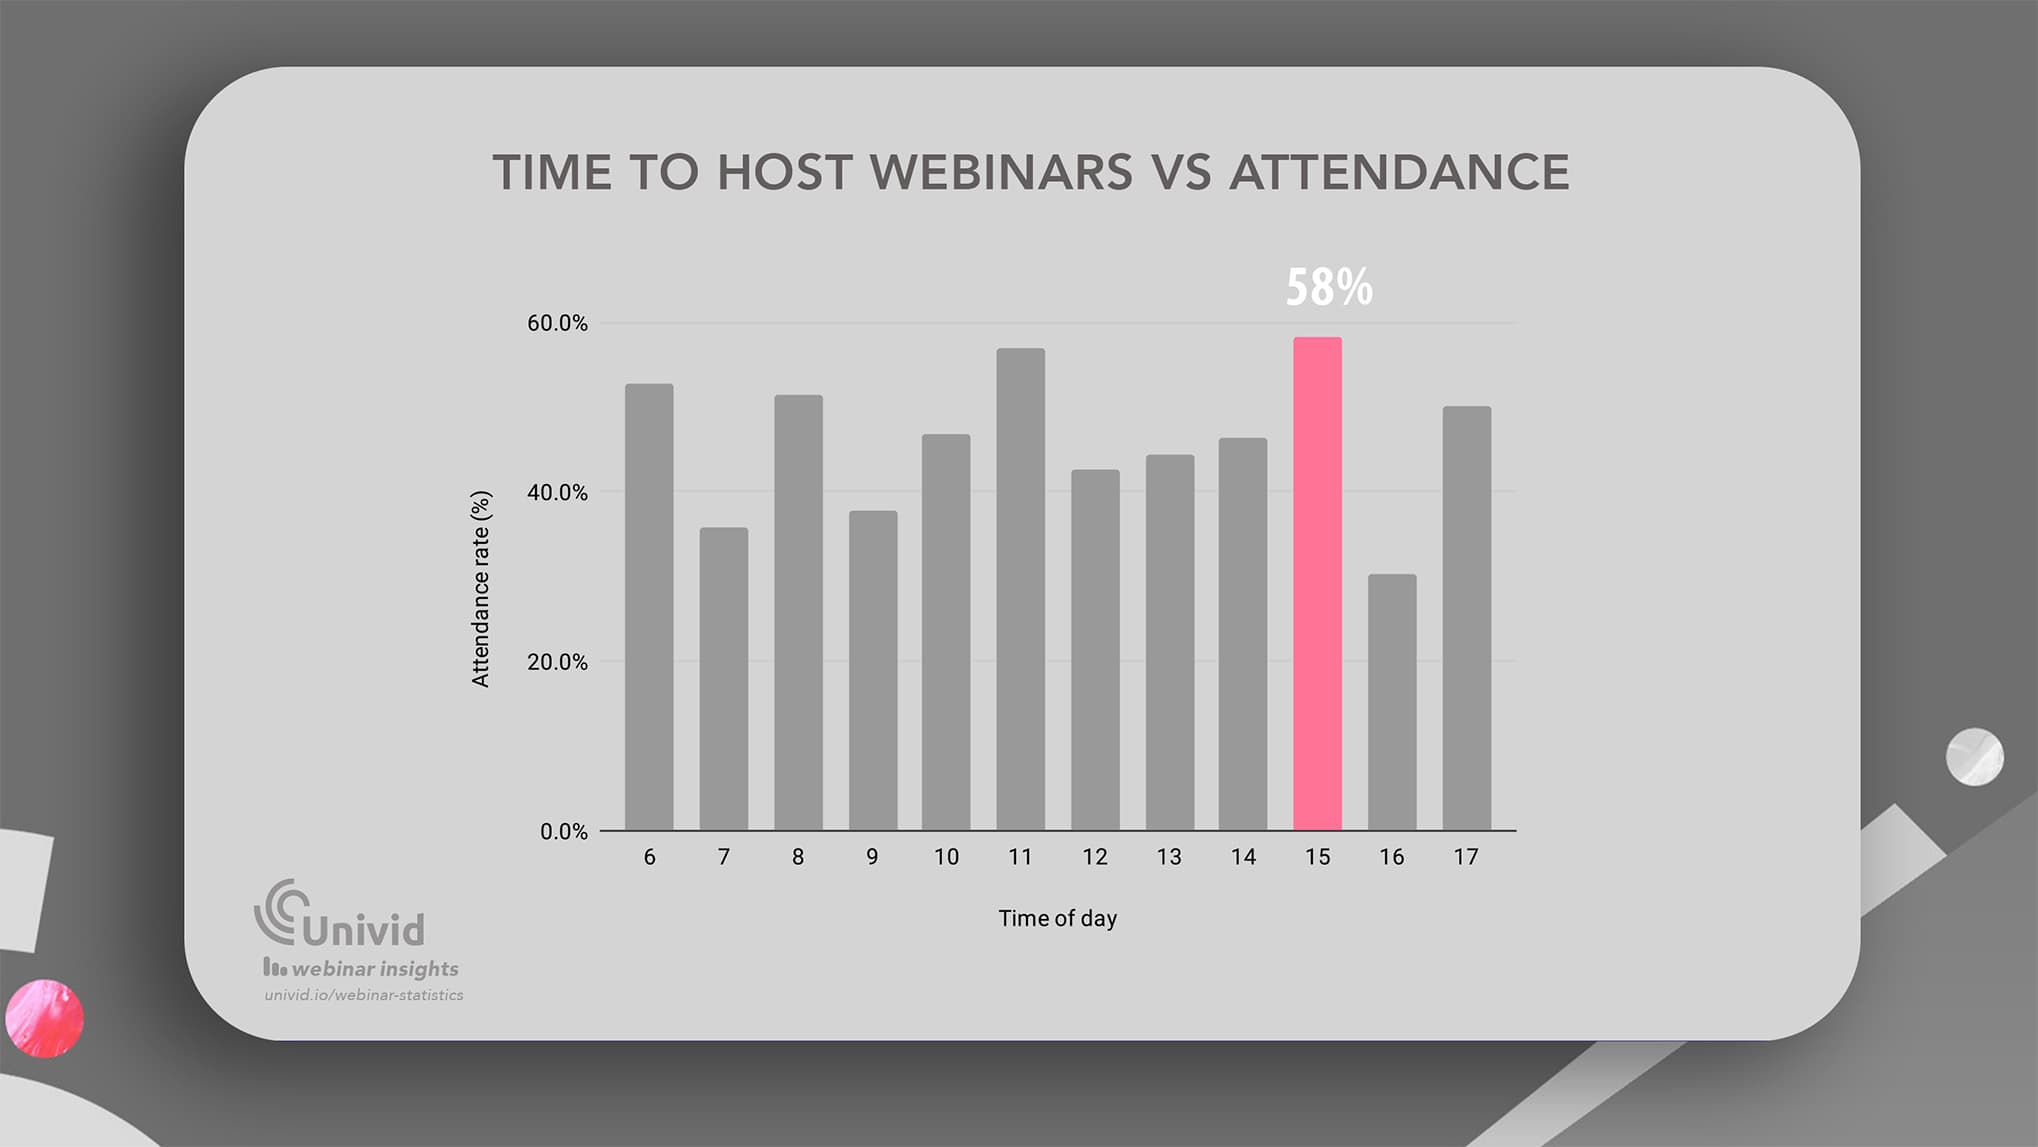
More specifically:
Webinar start time | Average live attendance rate |
|---|---|
6AM | 52.7 % |
8AM | 51.5 % |
11AM | 56.9 % |
3PM | 58.3% |
The time of day to host webinars that yields the highest average live attendance rates.
💡 Scheduling insight: Always consider your audience's time zone and work schedule. For global audiences, mid-afternoon (2-3 PM) often maximizes overlap, while early-morning slots (8 - 11 AM) can work well for regional or niche audiences.
Frequently asked questions (FAQs)
Q: Are webinars dead?
No, webinars are not dead; they are evolving and you need to know how to adapt. As a matter of fact, recent reports show marketers look to spend more on live streaming and webinars in 2026. Three datapoints that support this (1) live streaming is one of the top ROI content formats in 2025 - HubSpot, (2) webinars are the second fastest growing B2B event type of all - Forrester, and (3) 56% of B2B marketers used webinars in the last 12 months - Content Marketing Institute.


